We had the pleasure of speaking with Dr Suzanne Johansson, Pathologist at Kalmar county Hospital, who shared insights into her team’s journey implementing AI for biomarker assessment in their pathology lab in Sweden.
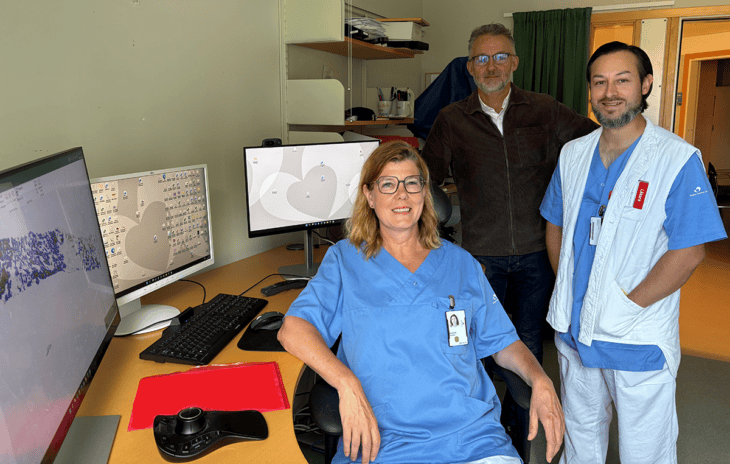
Suzanne Johansson, Senior Consultant in Pathology and Cytology
Hans Olsson, Senior Consultant in Pathology and Cytology
Charlie Bensefelt, Specialist in Pathology and Cytology
Suzanne Johansson has worked as a specialist in Pathology since 2009 and is head of the Breast Pathology and Skin Pathology sections in Kalmar.
The Pathology Department at Kalmar County Hospital is a typical Swedish regional hospital serving a population of approximately 250,000 residents. The department handles around 20,000 diagnostic cases annually and encompasses histopathology, autopsies, outpatient services, and parts of molecular pathology. The department consists of a team of specialist pathologists and physicians in training who work together across most pathology subspecialties.
Kalmar has long been an early adopter of digitalization within pathology.
What led you to search for a solution like Visiopharm? What type of problems or limits were you experiencing in the lab?
Above all, we were looking to improve reproducibility particularly for predictive and prognostic biomarkers. We started working with AI applications years ago and different alternatives have existed over the years, but none of them have been robust enough. So we’ve had this in the back of our minds for a long time. We tested different options, and other colleagues did the same. One of my former colleagues spent a long time evaluating various alternatives, but there really wasn’t any complete solution available. You still had to manually select the areas yourself and do a lot of the work.
We also wanted an open solution that could work with different scanners and LIS/LIMS systems and give us flexibility if we decide to make changes in the future. And of course we were looking for something that could deliver consistent, high-quality results.
Why did you choose Visiopharm, what made the difference?
Visiopharm had been mentioned in various presentations at events and we already had positive experiences with you from scanner sales. What made the difference for us was the ability to stay in control. We wanted a solution that supports the pathologist rather than replacing their judgement. The ability to review, adjust, add, or remove regions is very important. We can still take ownership of the case, remain responsible for the final assessment and are not locked into something that wasn’t correct. For example, in lobular cancer, if the AI has missed an area, you can add and you can still achieve a more accurate assessment, letting the AI perform the counting while you control the selected area.
Initially, we thought that we only needed Ki-67, because that is difficult to count, time-consuming, and should be done on whole sections. […] This was the biomarker where we believed reproducibility was weakest. Having AI for this would also save time, but above all the quality would increase.
When you started looking, was there a specific biomarker you had in mind? What was most interesting then?
Initially, we thought that we only needed Ki-67, because that is difficult to count, time-consuming, and should be done on whole sections. The other methods that exist are really just subjective, where you make a selection, but when counting the whole section, you get a more correct picture because more cells are counted. This was the biomarker where we believed reproducibility was weakest. Having AI for this would also save time, but above all the quality would increase.
However, once I started testing the applications, I realised there was also value in markers that I had considered straightforward, such as estrogen receptor. When values are around the threshold, they significantly impact treatment decisions, and my “pathologist brain” cannot reliably distinguish between, for example, 5% and 15% across several thousand cells.
I also highly value the stratification provided for HER2: how many 1+ cells, how many 2+, and how many 3+ are in the sample. This will become even more important as we move toward HER2 ultra-low classifications, which I think is going to become complicated. Actually, as it stands now, only a single positive cell is required to give treatment.

Example of HER2 analysis by Visiopharm
How has having the APP support changed the way you work?
For myself, I have observed that I often estimate higher Ki-67 values than the APP. With subjective assessment, at least in my case, my attention is drawn to positive cells, causing me to miss the larger number of negative ones. Cases I would previously consider intermediate, around 6–10%, may now fall into a lower category when evaluated more objectively.
When it comes to APPs for predictive and prognostic factors, I believe the main benefit is that they provide a more objective value. Depending on how we use them, they can also save time, for example, if we run the APPs before reviewing and assessing the case.
For H&E in metastasis detection, I see it more as a screening tool. Based on the cases I’ve reviewed, it has not missed a single metastasis, not even submicrometastases. It has very high sensitivity and does detect additional findings, but then you simply go and look at them and either confirm them or reject them. We still go in and review all slides, but as you get used to this, the process will become faster. It is helpful that the APP uses a gradient, red indicating a strong suspicion, while orange and yellow indicate weaker suspicion. There will definitely be time savings for us.
Can you describe the process of implementing Visiopharm, how was the experience with our team and were they any concerns in the lab?
The process has been good, with strong communication and accessibility. Very responsive. We’ve always received good and quick support.
Part of the concern was that we would not have control over it or fully understand how it had reached its conclusion. But now that I have the possibility to go in and review in detail how it has made the assessment, I feel more confident in deciding whether to accept the value or choose the conventional approach instead. I use it as a support tool: I remain in control and can see exactly how it worked.
How do you see the future of digital pathology in your laboratory?
Very positively, we look forward to it. We feel that it will help us in all the areas where assistance is possible. Currently, AI performs better when it comes to numerical assessments and quantification, while the pathologist is very good at morphology. You can see the development, that AI is becoming increasingly good at morphology as well. We believe that, when used in the right way, this will lead to more precise diagnostics while also saving us time.
I believe Visiopharm is an excellent solution.
The main advantage is that it gives us a better basis for our assessments. It provides better support for diagnostic decision-making and can make the evaluations fairer for patients as well.
What would you say to other laboratories that are considering a similar solution?
I would recommend spending time exploring and testing the technology before making a decision. It is important to understand both the benefits and the potential limitations so that you feel confident moving forward. I believe Visiopharm is an excellent solution. The main advantage is that it gives us a better basis for our assessments. It provides better support for diagnostic decision-making and can make the evaluations fairer for patients as well. It shouldn’t matter which pathologist a case happens to be assigned to. Especially in borderline cases, the assessment becomes more objective and even small differences in interpretation can have clinical significance. And that’s really the key point. This has been our goal for many years, and now products finally exist that we consider robust and stable.
Read more about our diagnostic solutions for pathology labs here.
If you would like to speak with your team about your current workflow, contact us here.
 Visiopharm
Categories: Blog, Customer Stories Tags: clinical
29369
How HistologiX answers complex biomarker questions in drug development
Visiopharm
Categories: Blog, Customer Stories Tags: clinical
29369
How HistologiX answers complex biomarker questions in drug development
As multiplex and spatial biology become increasingly important in translational research and drug development, the ability to turn complex datasets into meaningful biological insights is critical.
We spoke with Cristina Suanno, Head of Image and Data Analysis at HistologiX, about how her team uses Phenoplex™ to answer complex biomarker questions and help sponsors make more informed development decisions.
Cristina Suanno is Head of Image & Data Analysis at HistologiX, where she leads the development and delivery of quantitative image and data analysis services for preclinical and clinical projects. She holds a Bachelor of Medicine and Surgery from the Università degli Studi di Ferrara, followed by a Master of Research in Molecular Pathology, Bioinformatics and Diagnostics from the University of Nottingham.
During her studies and throughout her career, she has developed extensive expertise in digital pathology and quantitative image analysis. Cristina now leads a multidisciplinary team of research and data scientists, who develop workflows for chromogenic and multiplex immunofluorescence studies. The team’s expertise spans from tissue segmentation, cell phenotyping, spatial biology and statistics and support pharmaceutical and biotechnology clients from early discovery through to clinical development.
About HistologiX
HistologiX is a GLP- and GCP-compliant, ISO 9001:2015 accredited CRO specialising in tissue-based biomarker analysis. Through a tailored combination of histology, immunohistochemistry, immunofluorescence, in situ hybridisation (including RNAscope™ and BaseScope™), pathology, advanced image analysis and data science, HistologiX generates quantitative data that help clients understand how drugs and devices influence key biomarkers at both the cellular and tissue level. Expertise includes regulatory testing, development and characterisation of monoclonal antibodies, cell therapies, oncolytic viruses, medical devices and small molecules, as well as regulatory Tissue Cross Reactivity (TCR) studies for therapeutic antibodies and antibody-like molecules.
Biopharma teams are increasingly adopting multiplex and spatial biology approaches. What challenges do sponsors face when trying to extract meaningful insights from these datasets?
mIF generates an enormous amount of information. The challenge is no longer generating the data; it is interpreting it and putting it into a biological context that makes sense. To do so, you need the right expertise.
Our team brings together biology, pathology, image analysis and data science, so we can look at the study from all those perspectives.
Our lab scientists can generate robust assays and high-quality images, Visiopharm can perform pretty much all types of analysis, the real value is in bringing all of that together, and that is something not everyone can do.
When sponsors approach HistologiX with complex biomarker or translational research questions, what are they typically trying to understand?
This is probably the most exciting part of a study, deciding which questions we should be asking the tissue and sometimes sponsors don’t know how much information you can get out even from a simple 8plex.
It is rarely just about prevalence anymore. Take a mIF assay, its value is not simply that it measures more markers. It is valuable because it preserves spatial context. So why not explore that further? Even when a sponsor initially asks for a simple positive cells quantification, we often encourage them to think more broadly because there is usually much more information in the tissue.
With Phenoplex, we can help answer questions such as:
- The Who – Which cells types are present?
- The Where – Is the target expressed where it’s supposed to be?
- The When – Does the TME change following treatment for example?
- The How – How are cells organised, are neighbourhoods or clusters changing?
Once we answer those questions, the biology and study background then can explain the why.
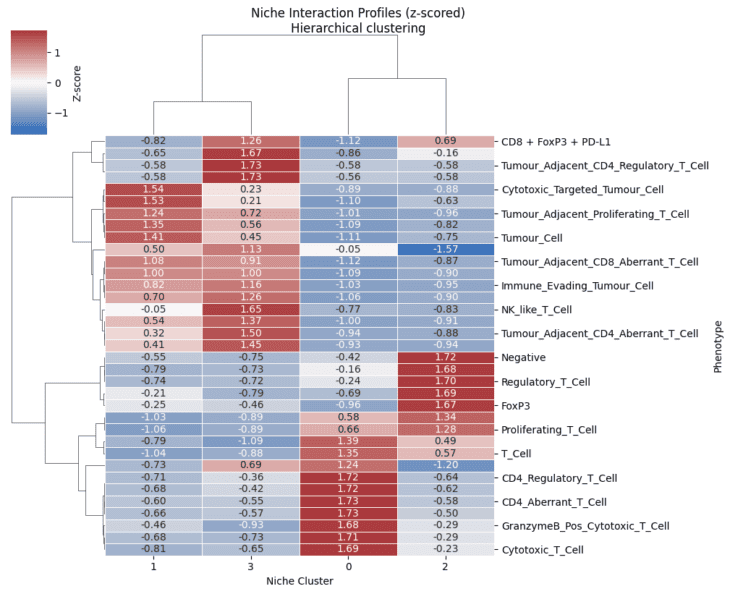
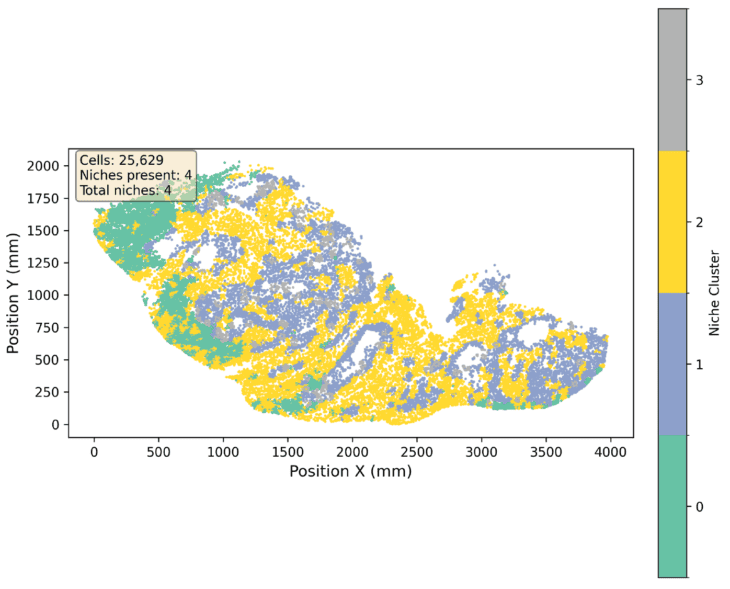
Following phenotype classification in Phenoplex, neighbourhood analysis is used to identify which cell populations tend to occur together within the local niches. The heatmap compares the cellular composition of these neighbourhoods, revealing distinct patterns of immune and tumour cell association across the TME.
How does Phenoplex fit into your workflow when addressing these questions?
Phenoplex gives us an end-to-end workflow for multiplex analysis, although, to be honest, we also use it for some single-plex studies during algorithm development.
One of its biggest advantages is how visual it is. You can immediately see whether your cell classification is performing well and the Explore and QC modules make it very easy to identify outliers. QC becomes part of the analysis rather than something you only review at the end.
We act as an extension of our clients, so being able to trust the data is key for us as much as it is for them, which makes QC particularly valuable. We need to distinguish genuine biological outliers from algorithm caveats and limitations. Sometimes an outlier means the analysis needs refining; other times, it is telling you something biologically interesting.
Phenoplex helps us spend more time interpreting the biology and less time managing a complex analysis workflow.
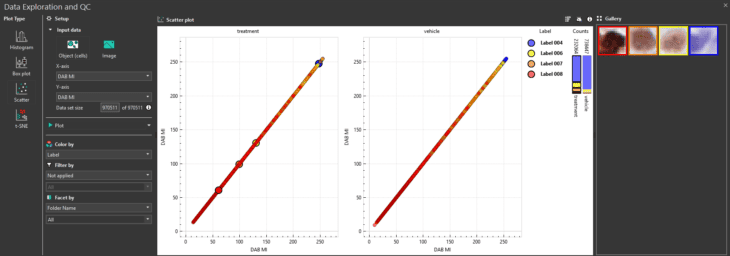
The Data Exploration and QC module is used to review algorithm performance and identify potential outliers across a dataset. In this chromogenic study, treatment and vehicle groups are compared, while weak, moderate and strong positivity classification is assessed (Label 4, blue, Negative cell; Label 6, yellow, Weak cell; Label 7, orange, Moderate cell; Label 8, red, Strong cell).
Can you share an example where HistologiX used Phenoplex to help answer an important drug-development question?
Sure. A recent study involved the investigation of a number of TAA in a specific tumour type.
Rather than simply reporting colocalization and phenotype counts, we used Phenoplex to quantify the populations within tumour and stroma compartments and then looked at how they were organised spatially in the tissue.
While the overall prevalence of some markers did not change very much, their colocalization and spatial organisation in particular foci of the tumour changed considerably. That was not obvious from simple cells counts alone and when these results are combined with patient metadata, these are the findings that generate the most interesting biological discussions when the dataset is returned to the sponsor.
Have you used Phenoplex to help sponsors better understand how a therapy is affecting the tumour microenvironment?
Absolutely. We usually work with sponsors from the study-design stage, thinking about which biomarkers are most appropriate for the questions they want to answer. That means sitting down sponsor and HistologiX lab scientists, IA scientists and data scientists all together to understand the study background.
We have extensive experience working with pre- and post-treatment sample sets, including clinical trial samples. Phenoplex is the perfect tool to quantify changes in immune populations, assess co-expression and explore spatial relationships such as immune infiltration, proximity and neighbourhood analysis, or distance from vessels and tumour margins.
Technically, these analyses are relatively straightforward in Visiopharm, and once you begin visualising the data with timepoints and samples metadata, treatment related patterns get revealed.
Beyond generating high-quality data, what impact can these insights have on a sponsor’s development programme?
Ultimately, you do not know what you do not know, and sponsors need good data that allow them to make informed decisions.
They will often come to us with a list of predefined outputs, and Phenoplex handles those very well. But because we like to think outside the box, and because Visiopharm is the perfect ally for this thanks to its flexibility, the most exciting part is often when we go beyond what was originally requested and explore the biology in more depth. That is where unexpected findings can emerge, and spatial analysis is particularly useful for uncovering hidden patterns.
Image analysis is a sort of scientific storytelling, Phenoplex helps us reveal the biology, and we bring it together through clear visualisations and robust statistics, so that sponsors can truly understand the data they have in hand. I think that’s the real value image analysis brings to a project. To me, that’s the real value image analysis brings to a project.
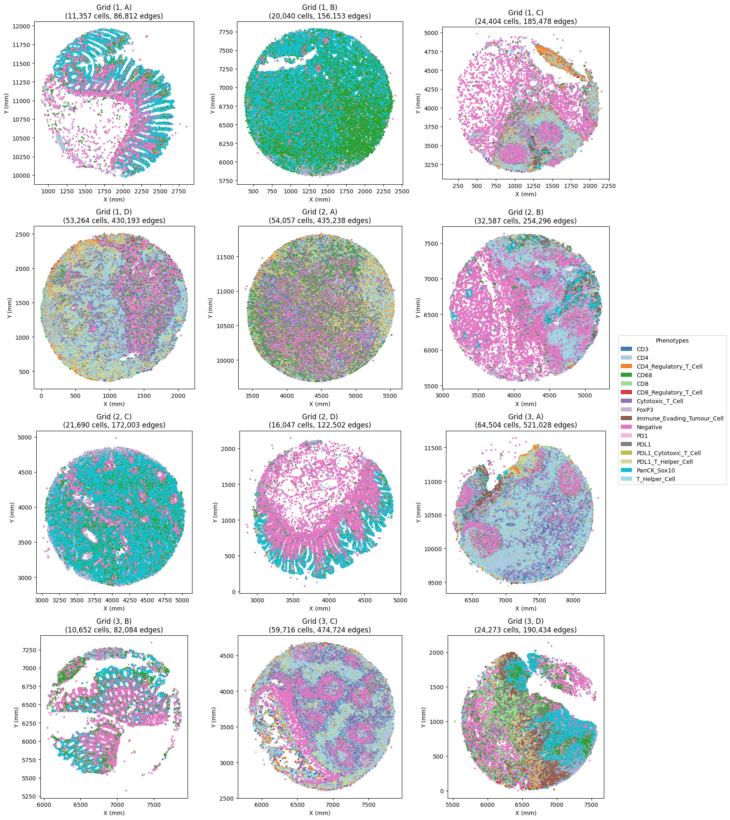
Cells are classified into phenotypes based on marker expression and mapped back to their spatial location within each tissue sample. This allows differences in phenotype and tissue organisation to be compared across samples while retaining the original spatial context.
What role does reproducibility play when generating data that may influence development decisions, and how does Phenoplex help support this?
Reproducibility is absolutely fundamental. If you cannot reproduce the analysis, you cannot have confidence in the conclusions.
Because HistologiX also have a full wet lab, we are often asked to assess assay reproducibility, and IA naturally becomes part of that validation process.
We have used Phenoplex together with statistical analysis to validate assays for clinical-trial use and assess batch-to-batch variability. Applying the same analysis workflow across batches allows us to determine whether observed differences reflect true biology, assay variation or analysis variability. That gives both us and the sponsor much greater confidence in the final data.
Contact HistologiX to learn more about their digital image analysis services.
Are you curious to hear more about our multiplex software? Contact us here for more information.
Visiopharm
Categories: Blog, Customer Stories
26989
Visiopharm software updates: 2026.08.4
We’re excited to share that a new release of the Visiopharm Platform has arrived. The 2026.08.4 Release, available August 2026, brings a range of enhancements designed to make your experience smoother, faster, and more intuitive. Our last release was 2026.02.1 in February 2026, and we’ve been busy building improvements we think you’ll appreciate.
Prefer to read? Keep scrolling to explore the key enhancements.
What’s new
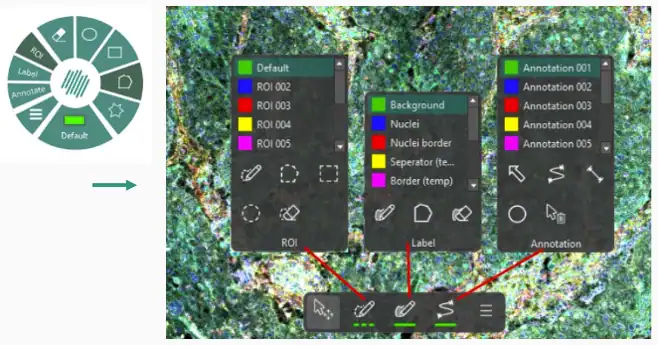
New drawing tool bar
A new Drawing Tool bar is located at the bottom of the working area. The user can now see the drawing tool by default and the conventional layout means that it is easier to navigate and draw overlays. The new tool contains the existing tools from the wheel.
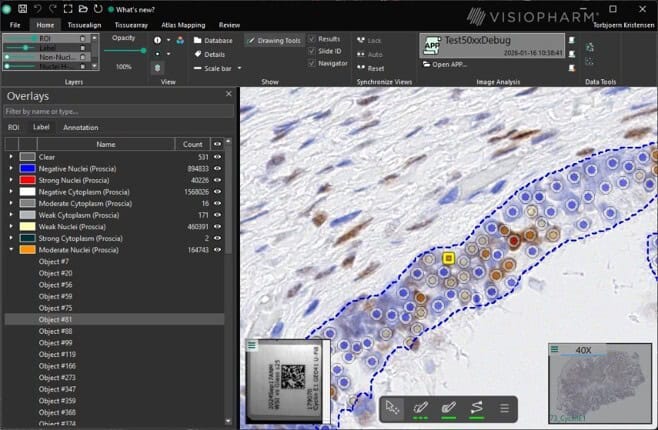
Overlay panel
A new Overlay Panel is available in the Viewer. It can be toggled on/off from the View section in the Ribbon. The panel lists the ROIs, labels and Annotations in the image and can be used to review the training labels in the image or the results from an APP. The Overlay Panel is interactive and allows the user to change the class, the type, rename or delete and object. Furthermore, there is a search option and when selecting an object in the list, it zooms to the corresponding object in the image.
Simplified ribbon
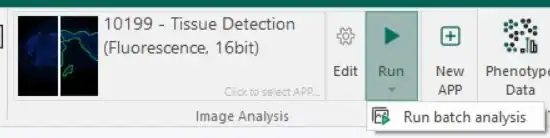
This release comes with a Simplified Ribbon where wording, icons, and placements of features have been updated.

A Batch Analysis can now be started directly from the ribbon.
Quickstart APPs
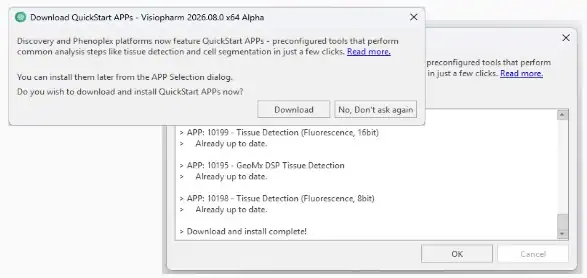
It has been made easier to access Quickstart APPs. At first startup or upgrade, the user is asked if they want to download Quickstart APPs.
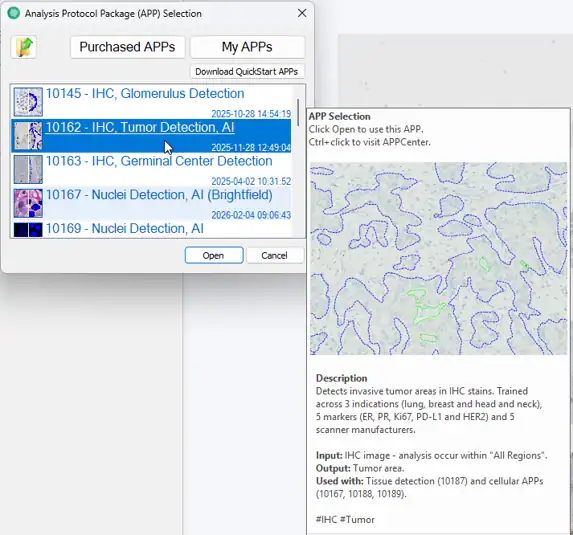
When hovering over a Quickstart APP, information about the APP and an example of the analysis are shown. This makes it easier to understand how the APP works and which other APPs it can be combined with.
New and updated Quickstart APPs
This release introduces 3 new Quickstart APPs and an update to an existing APP.
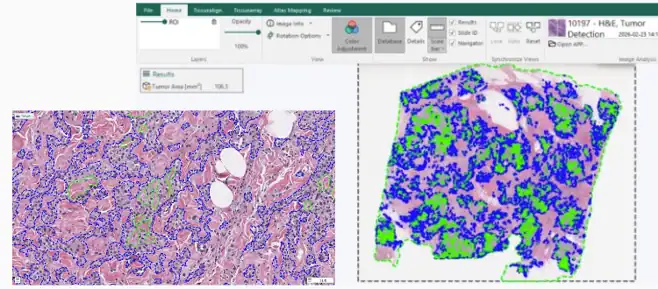
10197 – H&E Tumor Detection
The APP has been trained on 5 indications; breast, lung, colon, and ovarian tissue. It outlines tumor with a ROI and calculates the tumor area in mm2. It can help with downstream analysis such as comparing tumor areas between samples, multi-modal analysis, and detection of cells within the tumor.
10198 & 10199 – Tissue Detection (Fluorescence)
The Quickstart APP portfolio was missing tissue detection for fluorescence images, 10198 – Tissue Detection (Fluorescence, 8bit) and 10199 – Tissue Detection (Fluorescence, 16bit) solves this issue. The APPs output area of tissue in mm2 and counts the number of tissues on the slide.
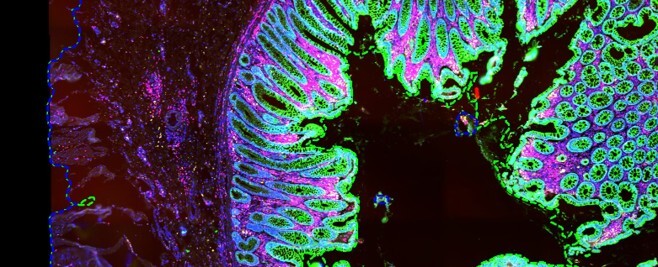
10200 – Tumor Detection (Fluorescence)
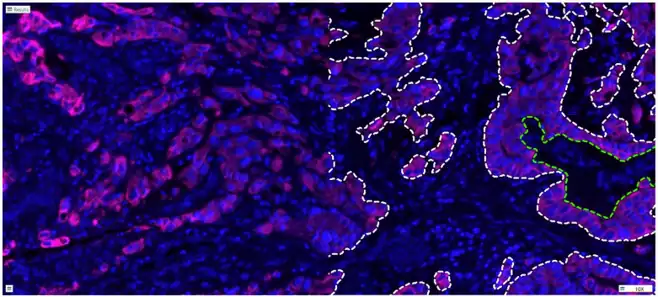
AI based tumor detection APP for fluorescence images. It runs on DAPI and PanCK as the input channels. It outlines the tumor with a ROI and calculates the tumor area in mm2 and the tumor area percentage. It works on 8bit images out of the box, but the input intensity ranges can be adjusted for it to work on 16bit or higher.
Updated 10162 – IHC Tumor Detection
The updated APP has been trained on breast, lung, and head/neck cancer. The APP performance has improved across all three indications. It outlines the tumor with a ROI and calculates the tumor area in mm2.
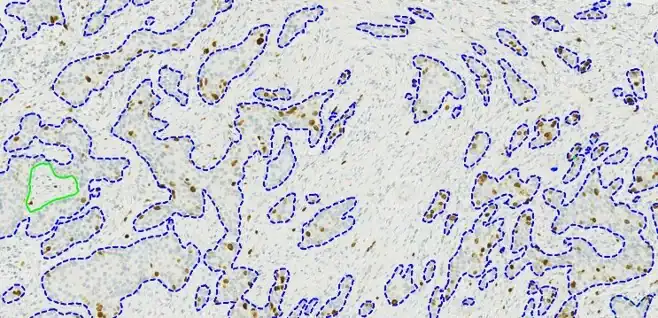
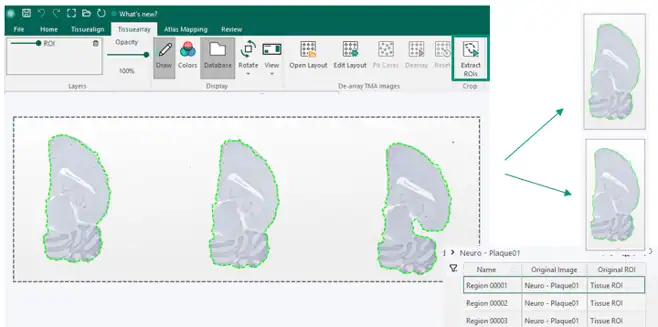
Image crops
As part of Tissuearray a feature has been added to make it possible to create image crops based on ROIs. The workflow replicated the Tissuearray behavior by saving the cropped images in a subfolder and image resolution is preserved.
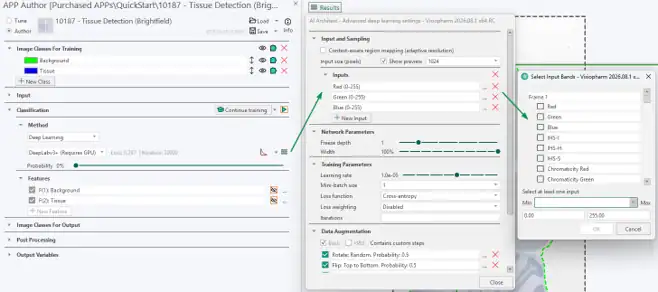
AI inputs and training
There are now more options for AI inputs, beyond just the channels presented with the image. These additional channels are derived channels and deconvolved channels.
The AI input upgrades triggered the internal AI data pipeline to be rewritten and optimized which results in faster AI training. The changes were internal optimizations in data-serving, loading and pre-processing that feed tiles to the deep learning training much faster.
CUDA Toolkit has been updated to ensure Visiopharm is compatible with newer NVIDIA GPUs RTX 50xx, 60xx series for AI training. The updates will support Hopper and Blackwell architecture GPUs. This also means that this release will not support GTX 10xx (Pascal architecture) and older. This is due to Nvidia marking Pascal as end-of-life already in October 2025.
For Customers only
You can find full details in our release notes and download the latest version on the download page.
Please note that this release is for research use only
Guides and videos showing the new features can be found on our e-learning portal.
If you’re unable to download the update, please reach out to our support team.
We hope these enhancements make your work in Visiopharm even more efficient and enjoyable. Thank you for being part of the Visiopharm community — we’re excited for you to explore what’s new.
 Visiopharm
Categories: Product Releases
Visiopharm
Categories: Product Releases