Multiplex software for multiplex users.
Phenoplex™
Multiplex software for multiplex users.
As new staining technologies such as imaging mass cytometry (Standard BioTools Hyperion XTi™) and high-plex fluorescent panels (Akoya PhenoCycler® or Lunaphore Comet®, etc.) stretch our abilities to interrogate the tumor microenvironment using spatial biology, finding meaningful differences in your data becomes a challenge.
Phenoplex is a complete workflow software for multiplex tissue images in Spatial Biology, built on Visiopharm’s best-in-class AI, with interactive verification steps throughout. Make new discoveries, compare between cohorts, or reproduce previous results, no matter the plex level.
Use the pre-trained cell detection for accurate and robust identification of cells. Train the system to separate your different tissue regions for better spatial biology data.
No matter your imaging system and plex level of your assay, Phenoplex has the solution for all spatial biology assays: Fully automated phenotyping for up to 8 Markers and user-guided phenotyping for 8-40+ markers.
Interactive Data Exploration tools support your data analysis and review steps.
Continuously verify your results during image analysis workflow. Plots can be adjusted to display each tissue compartment, phenotype, biomarker, or cell.

Matthew McFarlane, Image Analysis Scientist, OracleBio
Import images from all major multiplex image formats (Akoya Biosciences, Standard BioTools, Lunaphore, Rarecyte, Ionpath, Canopy Biosciences, Olympus, Zeiss and more). Set user-defined color channel groups of biomarker combinations and easily switch between them for quick visualization of cell types/marker groups and initial image QC. Assign colors to individual channels or channel groups and review each channel to make sure it contains good data. Exclude individual channels from downstream analyses during a QC step.
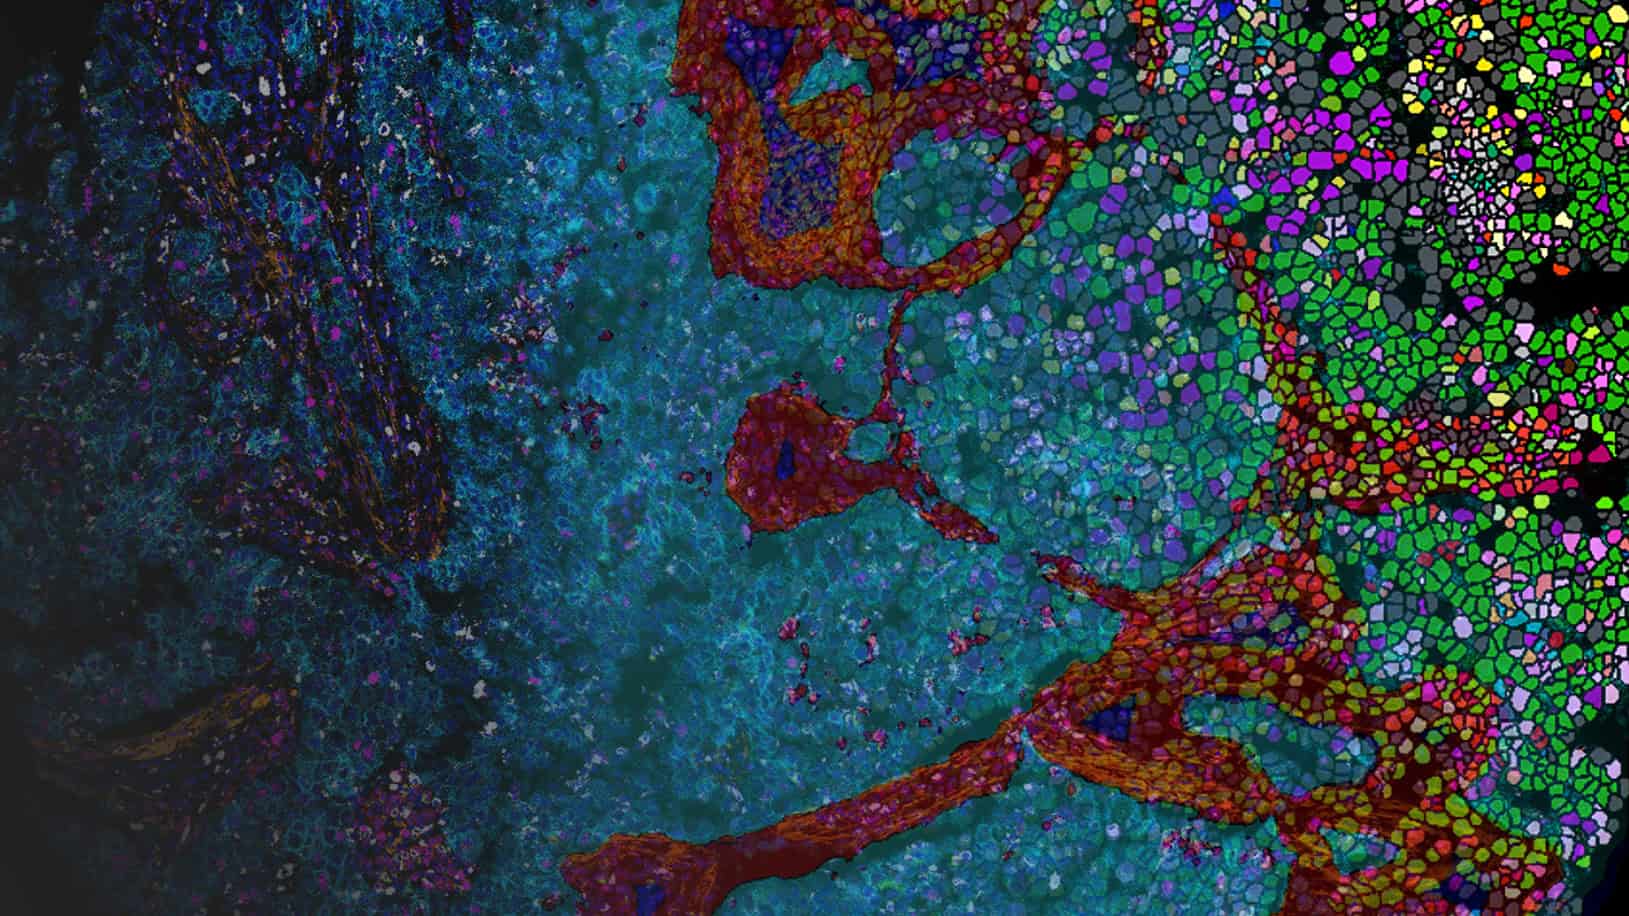
Use Paint-to-Train AI-based tissue segmentation on any combination of markers to detect morphologic regions of the sample: tumor, stroma, necrosis, artifacts, etc. Use these regions to better inform localization of immune and other cell populations in relation to the tumor, stroma, etc. Further divide the tumor into subregions, automatically exclude non-relevant areas (blank slide, artifacts, etc) and create margins around specific regions of interest, e.g., to define an invasive tumor front.
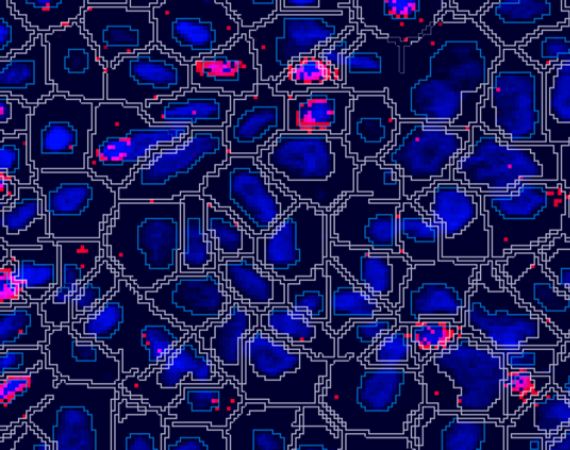
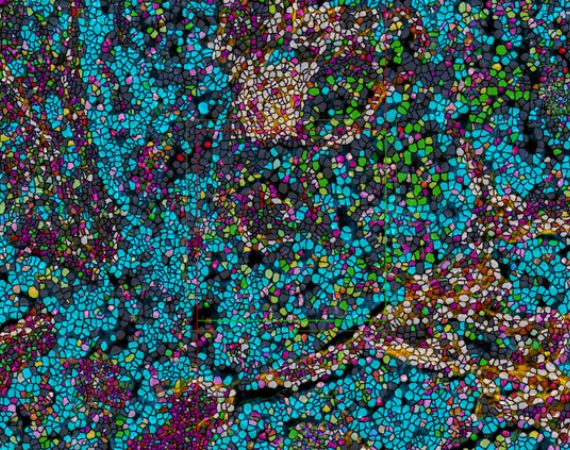
Use our pre-trained deep-learning-based nuclear detection and cell segmentation algorithms for fluorescence (DAPI) and imaging mass cytometry (DNA-Iridium channels). If you have special requirements for your cell detection, you can augment these algorithms to suit the particular needs of your cells and tissues, by adding additional markers to the detection, by annotating unusually shaped cells, or by adding postprocessing steps. This advanced nuclear segmentation method is highly accurate and robust across your data set.
Our automatic phenotyping workflow uses an automated unsupervised clustering algorithm, detecting the most common marker combinations. This workflow is ideal for multiplex images with up to 8 markers.
For highplex images Phenoplex offers a second workflow, allowing you to set gates for the best possible phenotypes for your samples. This new user-guided workflow is optimal for assays with more than 8 and up to 40 markers and beyond.
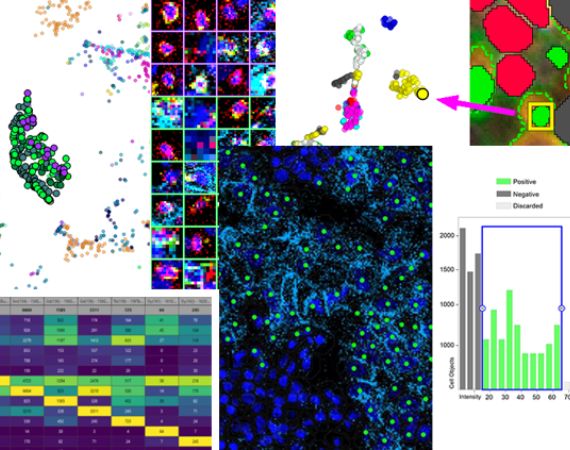
Phenoplex combines graphs with image re-coloring views so you can confirm the phenotyping results. Color t-SNE plots by cell type and link data points between graphs by selecting cells in one graph and view them in all others.
The guided phenotyping workflow has a new method for reviewing the frequencies of biomarker co-occurrence using a matrix table representing all biomarkers used during the workflow. Once finished with gating and biomarker co-occurrence review, the workflow generates a list with all unique phenotypes for graphing, plotting, and result export.
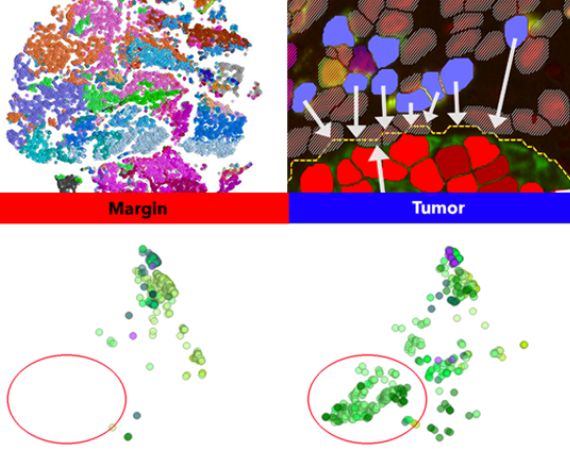
Phenoplex offers you a comprehensive collection of bidirectional evaluation plots to dive deeper into the results. Quantify different cell counts per regions and discover expression patterns. All results can be spatially analysed and evaluated for specific tissue areas.
Perform true spatial biology by calculating distances between phenotypes and to tissue class boundaries. Check for interaction or locate phenotypes in tissue areas. Perform neighborhood analyses or zone analysis for tumor margin cell count assessments. Classify and count cells based on their tissue compartment and correlate densities.
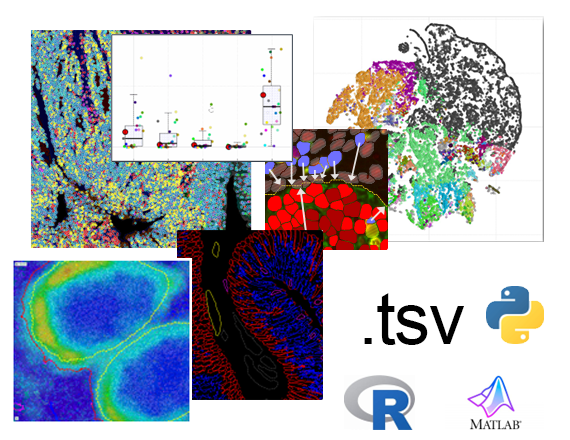
Phenoplex generates and exports meaningful data, imagery, and plots in standard formats and can save them into its database. All results, images, and generated outputs can be copy/pasted or exported as layer data (.mld), standard .tif and/or .tsv (tab-delimited) raw data files.
Perform subsequent analysis in external data analysis pipelines through the .tsv files, which contain all detailed exports as saved to the database.
Alison Bigley, Principal Scientist at OracleBio