
Visualize, analyze and phenotype multiple images at the same time
The Interactive Multiview Analysis allows you to perform semi-automatic image analysis across multiple images simultaneously. Set thresholds for biomarker positivity across multiple images. Check data heterogeneity and review your images with a synced zoom factor.

Phenoplex – a complete workflow for all your multiplexed image analysis needs.
Immune checkpoint inhibitors (ICIs) Pembrolizumab and Nivolumab have shown promising results in patients with recurrent or metastatic (R/M) head and neck squamous cell carcinoma (HNSCC). Nonetheless, only up to 20% of patients may benefit from them. Next generation predictive biomarkers of response to ICI therapies are currently needed.
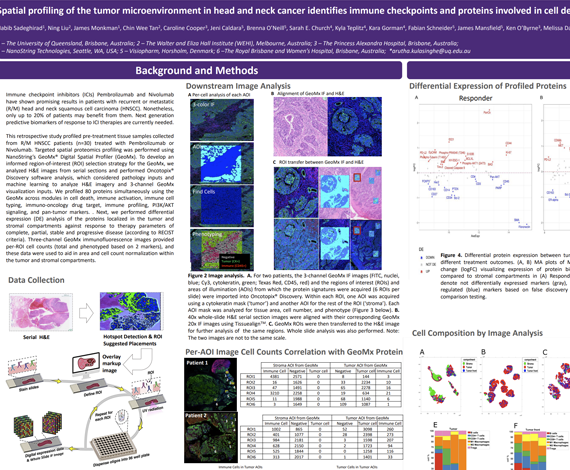
This retrospective study profiled pre-treatment tissue samples collected from R/M HNSCC patients (n=30) treated with Pembrolizumab or Nivolumab. Targeted spatial proteomics profiling was performed using NanoString’s GeoMx® Digital Spatial Profiler (GeoMx). To develop an informed region-of-interest (ROI) selection strategy for the GeoMx, we analyzed H&E images from serial sections and performed Oncotopix® Discovery software, which considered pathology inputs and machine learning to analyze H&E imagery and 4-channel GeoMx visualization inputs. We profiled 80 proteins simultaneously using the GeoMx across modules in cell death, immune activation, immune cell typing, immuno-oncology drug target, immune profiling, PI3K/AKT signaling, and pan-tumor markers. Next, we performed differential expression (DE) analysis of the proteins localized in the tumor and stromal compartments against response to therapy parameters of complete, partial, stable and progressive disease (according to RECIST criteria).
Four-channel GeoMx immunofluorescence images provided per-ROI cell counts (total and phenotyped based on 3 markers), and these data were used to aid in area and cell count normalization within the tumor and stromal compartments. We found that patients responsive to immunotherapy had higher expression levels of PD-L1, Bcl-2, BCLX, and BIM in the tumor, whereas VISTA, FOXP3, and CD66b were downregulated. In the stromal compartment, it was found that responders had higher expression levels of B7-H3, CD40, and SMA, but lower expression of PARP, S100B, and NY-ESO-1 in comparison to non-responders. In terms of best response analysis, patients with PR (n=5) had higher levels of PD-L1, ER-alpha, and CD68 expression, but lower levels of VISTA, CD27, and CD95/Fas in tumor regions than patients with PD (n=8). In the stroma, PD-L1, CD68, and HLA-DR were upregulated, while VISTA, BIM, and BAD were downregulated in patients with PR versus those with PD.
We found that informed ROI selection strategy aided in defining key features in the tumor microenvironment for comparative analysis across samples, and for data normalization methods. Moreover, we found that immune checkpoints and proteins involved in cell death signaling play important roles in the immune responsive tumor microenvironment of HNSCC based on response to immunotherapy.
Habib Sadeghirad1, Ning Liu2, James Monkman1, Chin Wee Tan2, Caroline Cooper3, Jeni Caldera4, Sarah Church5, Fabian Schneider4, James Robert Mansfield4, Ken O’Byrne3, Melissa Davis2, Brett Hughes6, Arutha Kulasinghe1
- The University of Queensland, Brisbane, Australia
- The Walter and Eliza Hall Institute, Melbourne, Australia
- The Princess Alexandra Hospital, Brisbane, Australia
- Visiopharm, Horsholm, Denmark
- Nanostring, Seattle, WA
- The Royal Brisbane and Women’s Hospital, Brisbane, Australia
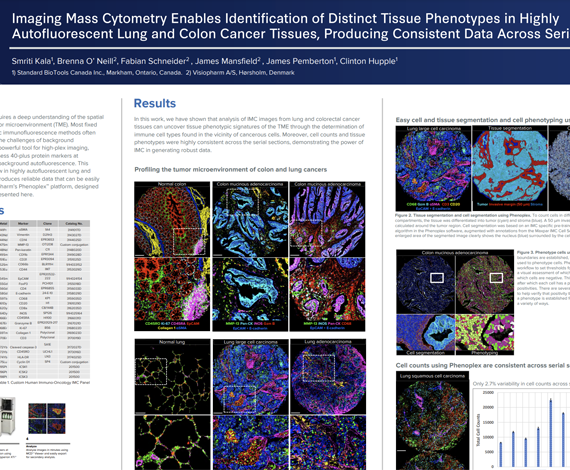
Successful implementation of immunotherapy requires a deep understanding of the spatial interactions between various cell types in the tumor microenvironment (TME). Most fixed tissues are autofluorescent and staining with cyclic immunofluorescence methods often produces data that are difficult to analyze due to the challenges of background subtraction. Imaging Mass Cytometry™ (IMC™) is a powerful tool for high-plex imaging, utilizing CyTOF® technology to simultaneously assess 40-plus protein markers at subcellular resolution without spectral overlap or background autofluorescence. This study demonstrates a tissue phenotyping workflow in highly autofluorescent lung and colon cancer tissues using high-plex IMC, which produces reliable data that can be easily analyzed.
Smriti Kala1, Brenna O’ Neill2, James Pemberton1, James Mansfield2, Fabian Schneider2, Clinton Hupple1
- Standard BioTools, Markham, ON, Canada
- Visiopharm, Hørsholm, Denmark
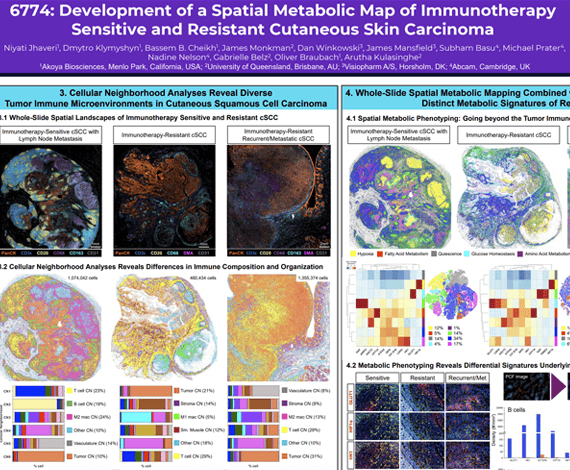
Cutaneous squamous cell carcinoma (cSCC) is the second most common skin cancer and represents a major global health burden. Approximately 50% of cSCC patients develop primary resistance and 20% will develop secondary resistance to immune checkpoint inhibitors (ICI). There are limited biomarkers that reflect the tumor dynamics predictive of response to ICI therapy, and therefore we need to explore new biomarkers that can better understand the cSCC tumor microenvironment (TME).
Niyati Jhaveri1, Dmytro Klymyshyn1, Bassem B. Cheikh1, James Monkman2, Dan Winkowski3, James Mansfield3, Subham Basu4, Michael Prater4, Nadine Nelson4, Gabrielle Belz2, Oliver Braubach1, Arutha Kulasinghe2
- Akoya Biosciences, Menlo Park, CA
- The University of Queensland, Brisbane, Australia
- Visiopharm A/S, Horsholm, Denmark
- Abcam, Cambridge, United Kingdom
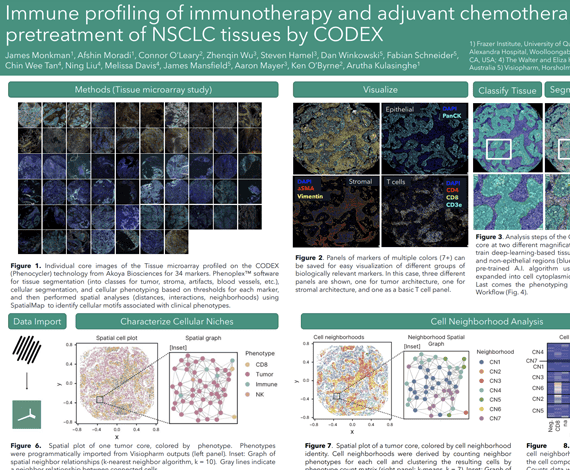
Non-small cell lung cancer (NSCLC), including adenocarcinoma and squamous cell carcinoma subtypes, is a leading cause of cancer deaths worldwide. Treatment of NSCLC has advanced from chemotherapy modalities to the use of immunotherapy, namely immune checkpoint inhibitors (ICIs) which enhance the adaptive immune response against tumour cells. Thus, while the immune cell composition of tumours and its influence on treatment outcomes is poorly understood, it likely holds the key to effective, personalized treatment regimens.
Here we profiled an adjuvant chemotherapy (n=61) as well as a second line immunotherapy (n=42) NSCLC cohort by the Phenocycler CODEX technology (highplex spatial proteomics) to investigate the association between immune composition and patient outcome. We applied a panel of 38 markers to delineate naïve, memory, cytotoxic and hyperactivated T cell states, as well as B cells, Tregs and myeloid lineage innate immune cell types. Our study sought to understand the heterogeneity of tumour-immune composition across patients and investigate the spatial neighbourhoods and clusters that these cells inhabit within TMA cores. We used Phenoplex™ software for tissue segmentation (into classes for tumor, stroma, artifacts, blood vessels, etc.), cellular segmentation, and cellular phenotyping based on thresholds for each marker, and then performed spatial analyses (distances, interactions, neighborhoods) using SpatialMap1 to identify cellular motifs associated with clinical phenotypes.
Our study has identified spatial features associated with immune contexture linked to therapy outcome in both chemotherapy and immunotherapy modalities. Taken together, our study demonstrates the utility of spatial proteomics to identify cellular features associated with outcome to therapy in lung cancer.
James Monkman1, Afshin Moradi1, Connor O’Leary1, Zhenqin Wu2, Steven Hamel2, David Mason3, Fabian Schneider3, James Robert Mansfield3, Aaron Meyer2, Ken O’Byrne4, Arutha Kulasinghe1
- The University of Queensland, Brisbane, Australia
- Enable Medicine, Menlo Park, CA
- Visiopharm, Horsholm, Denmark
- The Princess Alexandra Hospital, Woolloongabba, Australia