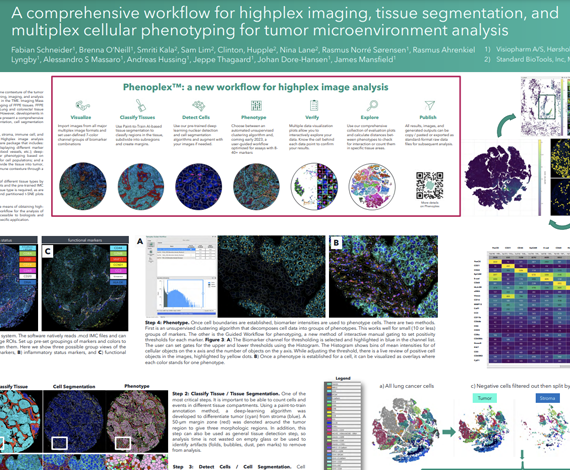
The growth in cancer immunotherapy agents requires an understanding of the immune contexture of the tumor microenvironment (TME). One way to understand immune contexture is to use multiplex staining, imaging, and analysis to obtain multi-marker phenotypes of specific cells and analyze their biodistribution in the TME. Imaging Mass Cytometry™ (IMC) is the method of choice for single-step staining and highplex imaging of FFPE tissues. FFPE tissue is autofluorescent, which limits the utility of immunofluorescence methods, particularly when done without amplification. Lung and colorectal tissue (and bone, skin, etc) are highly autofluorescence, and therefore are a good target for IMC imaging, which has no autofluorescence issues. However, developments in analysis software with a single-package workflow for highplex imagery have not kept pace. We present here a comprehensive workflow in the Oncotopix® Discovery platform designed specifically for highplex IMC image analysis, covering tissue segmentation, cell segmentation based on IMC DNA images, cellular phenotyping, and spatial analyses.
Fabian Schneider1, Brenna O’Neill1, Rasmus A. Lyngby1, Rasmus N. Sørensen1, Andreas Hussing1, Alessandro S. Massaro1, Andrew Quong2, Smriti Kala2, Sam Lim2, Clinton Hupple2, Nina Lane2, Michelle Macpherson2, Jeppe Thagaard1, Johan Doré Hansen1, James Mansfield1
- Visiopharm, Horsholm, Denmark
- Standard BioTools, South San Francisco, CA, USA

Imaging Mass Cytometry™ (IMC™) is a powerful tool for the study of complex cellular interactions in the tumor microenvironment (TME) and in the discovery of biomarkers that can predict disease outcome or response to therapy. The Hyperion™ Imaging System (Standard BioTools™) utilizes CyTOF® technology to simultaneously assess 40-plus protein markers at subcellular resolution without spectral overlap or background autofluorescence, thus providing unprecedented insight into the organization and function of the TME. However, despite the advances in staining and imaging methods, developments in analysis software have not kept pace, as we lack a complete, user-defined workflow in a single software package for analysis of high-plex imaging data. Here we present a comprehensive workflow using the Visiopharm® Phenoplex™ platform, designed specifically for high-plex IMC image analysis.
Smriti Kala1, Brenna O’Neill2, Rasmus Lyngby2, Rasmus Sorensen2, Andrew Quong1, Sam Lim1, Clinton Hupple1, Nina Lane1, Jeppe Thagaard2, Johan Dore Hansen2, James Mansfield2, Fabian Schneider2, Michelle Macpherson1
- Standard BioTools Canada Inc., Markham, Ontario, Canada
- Visiopharm A/S, Hørsholm, Denmark
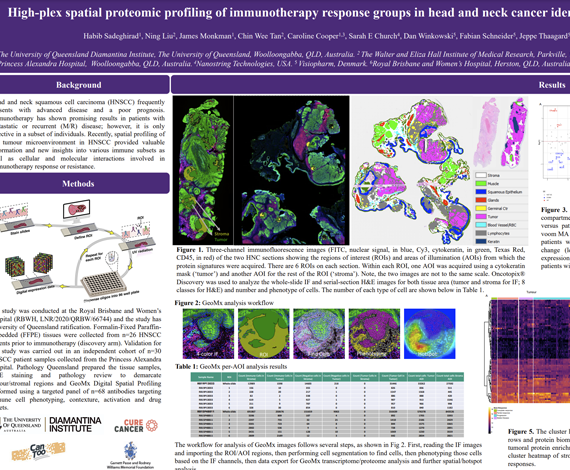
Head and neck squamous cell carcinoma (HNSCC) frequently presents with advanced disease and a poor prognosis. Immunotherapy has shown promising results in patients with metastatic or recurrent (M/R) disease; however, it is only effective in a subset of individuals. Recently, spatial profiling of the tumour microenvironment in HNSCC provided valuable information and new insights into various immune subsets as well as cellular and molecular interactions involved in
immunotherapy response or resistance.
Habib Sadeghirad1, Ning Liu2, James Monkman1, Chin Wee Tan2, Caroline Cooper1,3, Sarah E Church4, Dan Winkowski5, Fabian Schneider5, Jeppe Thaagard5, James Mansfield5, Ken O’Byrne3, Melissa Davis2, Brett Hughes6, Arutha Kulasinghe1
-
- The University of Queensland Diamantina Institute, The University of Queensland, Woolloongabba, QLD, Australia.
- The Walter and Eliza Hall Institute of Medical Research, Parkville, VIC, Australia.
- Princess Alexandra Hospital, Woolloongabba, QLD, Australia.
- Nanostring Technologies, USA.
- Visiopharm, Denmark.
- Royal Brisbane and Women’s Hospital, Herston, QLD, Australia
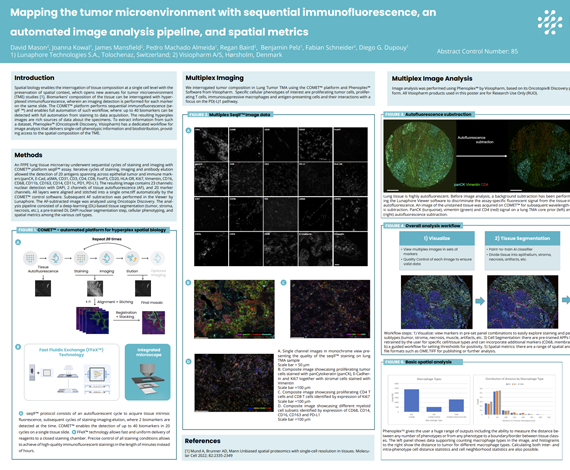
Spatial biology enables the interrogation of tissue composition at a single cell level with the preservation of spatial context, which opens new avenues for tumor microenvironment (TME) studies [1]. Biomarkers’ composition of the tissue can be interrogated with hyperplexed immunofluorescence, wherein an imaging detection is performed for each marker on the same slide. The COMET™ platform performs sequential immunofluorescence (seqIF ™) and enables full automation of such workflow, where: up to 40 biomarkers can be detected with full automation from staining to data acquisition. The resulting hyperplex images are rich sources of data about the specimens. To extract information from such a dataset, Phenoplex™ (Oncotopix® Discovery, Visiopharm) has a dedicated workflow for image analysis that delivers single-cell phenotypic information and biodistribution, providing access to the spatial composition of the TME.
David Mason2, Joanna Kowal1, James Mansfield2, Pedro Machado Almeida1, Regan Baird2, Benjamin Pelz1, Fabian Schneider2, Diego G. Dupouy1
- Lunaphore Technologies S.A., Tolochenaz, Switzerland
- Visiopharm A/S, Hørsholm, Denmark
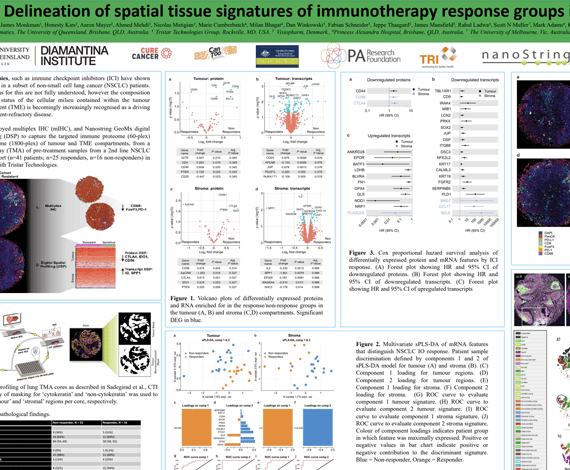
Immunotherapies, such as immune checkpoint inhibitors (ICI) have shown durable benefit in a subset of non-small cell lung cancer (NSCLC) patients. The mechanisms for this are not fully understood, however the composition and activation status of the cellular milieu contained within the tumour microenvironment (TME) is becomingly increasingly recognised as a driving factor in treatment-refractory disease.
Here, we employed multiplex IHC (mIHC), and Nanostring GeoMx digital spatial profiling (DSP) to capture the targeted immune proteome (60-plex) and transcriptome (1800-plex) of tumour and TME compartments, from a tissue microarray (TMA) of pre-treatment samples from a 2nd line NSCLCICI-treated cohort (n=41 patients; n=25 responders, n=16 non-responders) in collaboration with Tristar Technologies.
Arutha Kulasinghe1, James Monkman1, Honesty Kim2, Aaron Mayer2, Ahmed Mehdi3, Nicolas Matigian3, Marie Cumberbatch4, Milan Bhagat4, Dan Winkowski5, Fabian Schneider5, Jeppe Thaagard5, James Mansfield5, Rahul Ladwa6, Scott N Muller7, Mark Adams8, Ken O’Byrne8
-
- University of Queensland Diamantina Institute, The University of Queensland, Brisbane, QLD, Australia
- Enable Medicine, Menlo Park, CA, USA
- Qfab Bioinformatics, The University of Queensland, Brisbane, QLD, Australia
- Tristar Technologies Group, Rockville, MD, USA
- Visiopharm, Denmark
- Princess Alexandra Hospital, Brisbane, QLD, Australia
- The University of Melbourne, Vic, Australia
- Queensland University of Technology, Brisbane, QLD, Australia
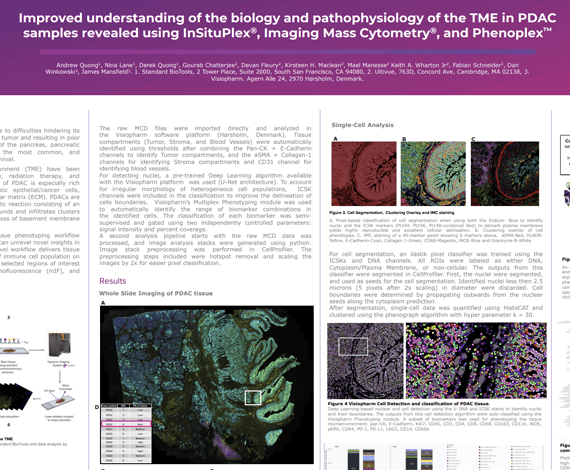
Pancreatic cancer remains a deadly disease due to difficulties hindering its early diagnosis, giving way to metastasis of the tumor and resulting in poor prognosis. While there are many neoplasms of the pancreas, pancreatic invasive ductal adenocarcinoma (PDAC) is the most common, and treatment options are few, with poor overall survival.
The complexities of the tumor microenvironment (TME) have been implicated in the failure of chemotherapy, radiation therapy, and immunotherapy. The tumor microenvironment of PDAC is especially rich with multiple interactions between pancreatic epithelial/cancer cells, stromal cells, immune cells, and the extracellular matrix (ECM). PDACs are characterized by a complex ECM of desmoplastic reaction consisting of an extensive and dense fibrotic stroma that surrounds and infiltrates clusters of malignant epithelial cells, together with the loss of basement membrane integrity and an abnormal vasculature.
In the present study we demonstrate a tissue phenotyping workflow combining three complementary methods that can unravel novel insights in the complex tumor microenvironment. This novel workflow delivers tissue morphology information, spatial phenotyping of immune cell population on whole slides, and high-dimensional imaging in selected regions of interest (ROIs) by combining H&E, multiplex immunofluorescence (mIF), and Imaging Mass Cytometry® (IMC®).
Andrew Quong1, Nina Lane1, Derek Quong1, Gourab Chatterjee2, Devan Fleury2, Kirsteen H. Maclean2, Mael Manesse2, Keith A. Wharton Jr2, Fabian Schneider3, Dan Winkowski3, James Mansfield3
-
- Standard BioTools 2 Tower Place, Suite 2000, South San Francisco, CA 94080
- Ultivue, 763D, Concord Ave, Cambridge, MA 02138
- Visiopharm. Agern Alle 24, 2970 Hørsholm, Denmark.