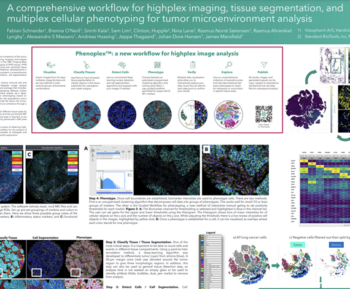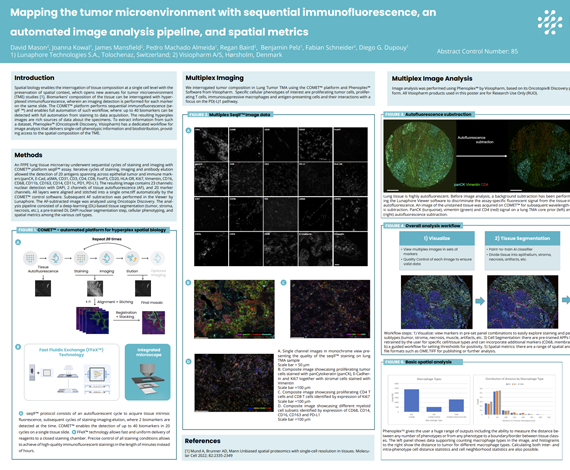
Spatial biology enables the interrogation of tissue composition at a single cell level with the preservation of spatial context, which opens new avenues for tumor microenvironment (TME) studies [1]. Biomarkers’ composition of the tissue can be interrogated with hyperplexed immunofluorescence, wherein an imaging detection is performed for each marker on the same slide. The COMET™ platform performs sequential immunofluorescence (seqIF ™) and enables full automation of such workflow, where: up to 40 biomarkers can be detected with full automation from staining to data acquisition. The resulting hyperplex images are rich sources of data about the specimens. To extract information from such a dataset, Phenoplex™ (Oncotopix® Discovery, Visiopharm) has a dedicated workflow for image analysis that delivers single-cell phenotypic information and biodistribution, providing access to the spatial composition of the TME.
David Mason2, Joanna Kowal1, James Mansfield2, Pedro Machado Almeida1, Regan Baird2, Benjamin Pelz1, Fabian Schneider2, Diego G. Dupouy1
- Lunaphore Technologies S.A., Tolochenaz, Switzerland
- Visiopharm A/S, Hørsholm, Denmark