Pancreatic cancer remains a deadly disease due to difficulties hindering its early diagnosis, giving way to metastasis of the tumor and resulting in poor prognosis. While there are many neoplasms of the pancreas, pancreatic invasive ductal adenocarcinoma (PDAC) is the most common, and treatment options are few, with poor overall survival.
The complexities of the tumor microenvironment (TME) have been implicated in the failure of chemotherapy, radiation therapy, and immunotherapy. The tumor microenvironment of PDAC is especially rich with multiple interactions between pancreatic epithelial/cancer cells, stromal cells, immune cells, and the extracellular matrix (ECM). PDACs are characterized by a complex ECM of desmoplastic reaction consisting of an extensive and dense fibrotic stroma that surrounds and infiltrates clusters of malignant epithelial cells, together with the loss of basement membrane integrity and an abnormal vasculature.
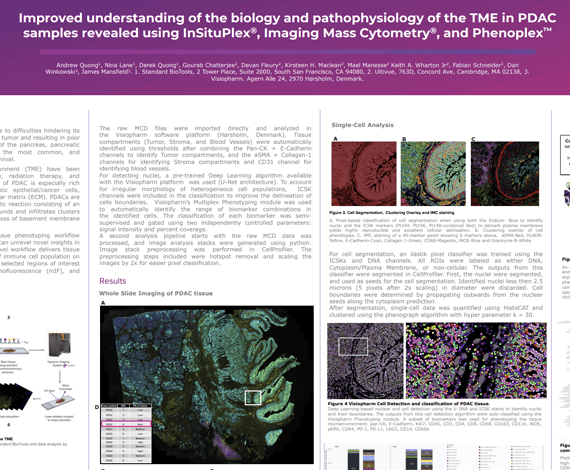
In the present study we demonstrate a tissue phenotyping workflow combining three complementary methods that can unravel novel insights in the complex tumor microenvironment. This novel workflow delivers tissue morphology information, spatial phenotyping of immune cell population on whole slides, and high-dimensional imaging in selected regions of interest (ROIs) by combining H&E, multiplex immunofluorescence (mIF), and Imaging Mass Cytometry® (IMC®).
Andrew Quong1, Nina Lane1, Derek Quong1, Gourab Chatterjee2, Devan Fleury2, Kirsteen H. Maclean2, Mael Manesse2, Keith A. Wharton Jr2, Fabian Schneider3, Dan Winkowski3, James Mansfield3
-
- Standard BioTools 2 Tower Place, Suite 2000, South San Francisco, CA 94080
- Ultivue, 763D, Concord Ave, Cambridge, MA 02138
- Visiopharm. Agern Alle 24, 2970 Hørsholm, Denmark.

In the final episode of the three-part series on phenotyping, Dr Aleksandra Zuraw and our Scientific Consulting Sales Manager, Regan Baird, discuss important factors to consider when selecting image analysis software for phenotyping.
Further reading:
The two key considerations when selecting a phenotyping image analysis software are segmentation assistance and data visualization.
Segmentation assistance: To determine cell phenotypes, the boundaries of cells in tissue slides must first be defined. This is known as cell segmentation and can be automatically performed by image analysis software. Cells in tissue slides can vary in shape and size, making segmentation difficult. Image analysis software can use either rule-based classical computer vision or AI-powered approaches to estimate cell boundaries. Visiopharm offers an AI-based nuclear segmentation followed by a rule-based and marker-based step to achieve the most accurate cell segmentation for phenotyping.
Data visualization: The proper visualization and management of obtained data is crucial and depends on the software used. To interpret multidimensional multiplex and phenotyping data, visualizations such as graphs, plots, and two-dimensional reduction plots must be used for all images in multiplex studies. The right visualization tools are needed to evaluate phenotyping performance and export meaningful results.
- Let us know what you think of the episode and any topics you would like us to cover in the future by sending us an email at: podcasts@visiopharm.com
Get ready for an exciting journey into the world of tissue imaging with the first episode of our mini series. Dr Aleksandra Zuraw is joined by expert Regan Baird, our Scientific Consulting Sales Manager, to dive into the fascinating topic of multiplex staining. Find out the different modalities, what’s best suited for tissue image analysis and why, and the many benefits and uses of multiplex staining. Regan shares his expertise and insights to help you get the most out of your imaging modalities.
Further reading:
After his postdoc at Beth Israel Deaconess Medical Center in Boston, where he experimented with multidimensional, multimarker and multicolor single cell imaging modalities, 2D images of tissue stained with hematoxylin and eosin (H&E) seemed simplistic to Regan Baird, PhD. Tissue image analysis (IA) can be challenging when relying solely on H&E. So, multiplex staining was implemented to simplify the process and extract more information.
In this miniseries, Regan introduces us to the concepts of multiplexing and cell phenotyping and relevant image analysis approaches for multiplex data analysis. Multiplexing in life sciences refers to taking multiple measurements on the same specimen at the same time. The easiest method of multiplexing with tissue slides is IHC-based virtual multiplexing.
More precise methods of visualizing cellular colocalization of biomarkers include multicolor bright field IHC (up to five biomarkers per tissue, two biomarkers per cell), IF with spectral unmixing (up to nine biomarkers per tissue and cell), and imaging mass cytometry (up to 60 biomarkers in a single tissue section). The choice of method should be based on the experiment and scientific/diagnostic questions.
IF multiplexing is widely used for cell phenotyping in tissue, allowing for characterization of single cells and investigation of spatial relationships between cell populations. This provides information about the interactome of different cells and their environment.
- Let us know what you think of the episode and any topics you would like us to cover in the future by sending us an email at: podcasts@visiopharm.com
In the second episode of our series on phenotyping with Dr. Aleksandra Zuraw and our Scientific Consulting Sales Manager, Regan Baird, learn how to make sense of multiplex data with phenotyping. Find out how to classify individual cells in tissue based on biomarker panels and why this is crucial for personalized therapeutic approaches in oncology. Discover the challenges of interpreting multiplex data, the use of machine learning-based auto-clustering, and the importance of software in visualizing and handling generated data. Stay tuned for the next episode where we’ll discuss considerations when choosing an image analysis software program for phenotyping.
- Let us know what you think of the episode and any topics you would like us to cover in the future by sending us an email at: podcasts@visiopharm.com
Cancer immunotherapy, or immuno-oncology, harnesses the power of the immune system to fight cancer. Scientists are using tissue image analysis with digital pathology and whole slide imaging to detect and quantify the multiple processes and immune cell populations involved in tumor immunology. Join Dr Aleksandra Zuraw and Prof Elfriede Noessner in this episode as they explain the complexities of the immune system and its role in curing cancer, and the role of tissue image analysis in the process.
- Let us know what you think of the episode and any topics you would like us to cover in the future by sending us an email at: podcasts@visiopharm.com
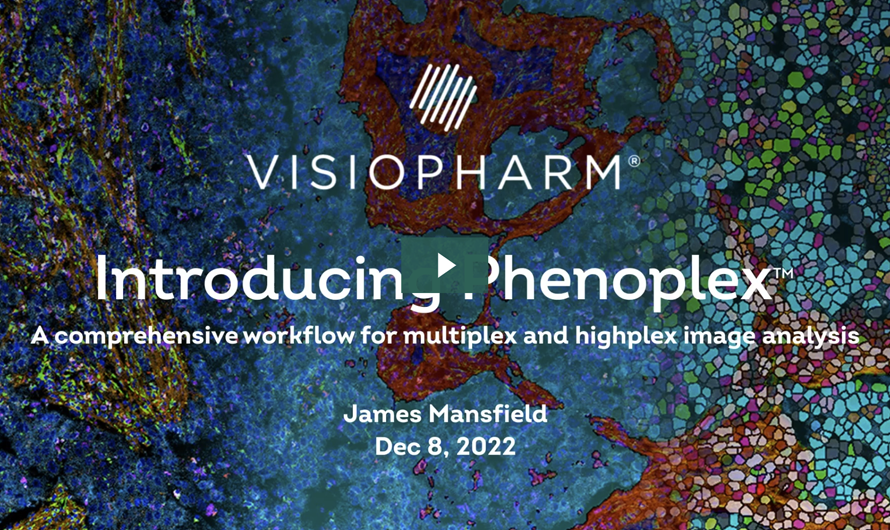
In this 18-minute webinar, James presents Phenoplex™, a new workflow solution from Visiopharm for all multiplex image analysis requirements. He outlines the various workflow steps, which efficiently evaluate spatial biology assays with 8-40 or more biomarkers. With its interactive evaluation tools, it enables the extraction of more information from each cell and its relationships.
-
- How pre-trained deep learning-based cell detection for DAPI or IMCTM stains accurately, robustly, and flexibly identifies cells.
-
- The two workflows for phenotyping multiplex and highplex images
-
- How to validate your results using interactive plots that link each data point with the underlying cell

James R. Mansfield, Senior Vice President, Research Business Development, Visiopharm
James R. Mansfield, a scientist with 30+ years of experience, including 15 in multiplex pathology and immune cell phenotyping. He is SVP of Research Business Development at Visiopharm, focused on their strategy for multiplex image analysis. Previously, he was Scientific Director at Magnetic Insight Inc, a start-up in magnetic particle imaging technology. He also held senior positions at Cambridge Research & Instrumentation, Inc (CRi) and PerkinElmer, where he played a key role in commercializing multispectral imaging for pathology.
 Sheila Hansen
Categories:
Sheila Hansen
Categories: