Transcript
Hi. This is Jim Mansfield.
I’m the senior vice president at Visiopharm, and I am here to talk to you about Phenoplex.
I need to show you this disclaimer because we have some regulatory approved products in Europe.
So the outline of my talk will be to talk a bit about Phenoplex, some details about how it works, and then a little bit about how this can be used to explore your biology.
First though, I’d like to say that Visiopharm is the market leader in computational pathology. We’ve been around for over twenty years now. There’s a lot of milestones that we’ve had along the way. We have a large company with a lot of, approved applications in Europe, but I’m not really here to talk to you about regular digital pathology. I am here to talk to you about multiplex imaging.
Multiplex imaging or spatial biology or multiplex pathology or whatever words you want to use to describe it is growing like crazy. In twenty thirteen, cancer immunotherapy really took over the world of cancer, research. And since then, the number of papers published on multiplex imaging have grown like crazy. For instance, between twenty twenty one and twenty twenty two, the number of abstracts on multiplexed imaging at AACR doubled, and that is a trend that’s expected to continue. It’s also a really nice way to get your beautiful multicolor images on the covers of some of the best journals that are out there.
There are a lot of different ways to collect multiplex images. I’m not gonna go into the imaging systems or how they work or which is better. There’s a lot of information out there on that. I do want to just mention, however, that when it comes to highplex Imaging, so imaging more than fifteen or twenty biomarkers, Imaging mass cytometry by standard bio tools is a really good way to do that. And a lot of what we’ve developed has been built around this, imaging modality.
But regardless of which method you use, people tend to wind up in this in between state. They have these beautiful multiplex images that they’ve collected. They’ve optimized their assays. They’ve spent a lot of time on that, and they would really like to get from that to their biology.
Can I tell who’s responding and who’s not responding? Can I learn something about the treatments that I’m giving? And unfortunately, there’s always this middle step that is kind of glossed over. And a few people have managed to write their own software and coding for doing that. However, it’s really not a simple process, at least up until now.
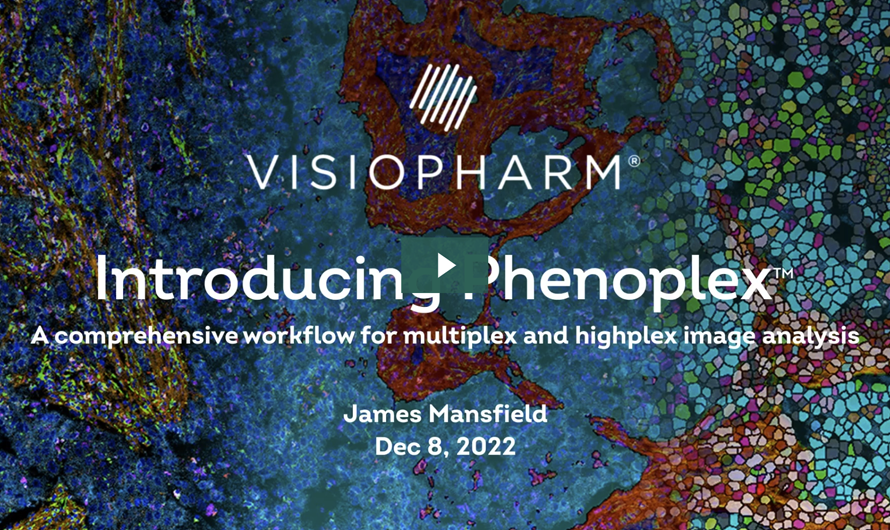
So we have partnered with Standard BioTools to develop this new, software package called Phenoplex, and we are putting that together with the Hyperion Imaging System to deliver that to you. But regardless of which imaging modality you use, Phenoplex is a complete workflow for all multiplexed imaging types, systems, plex levels, whatever you wanna call it. And we’ve broken this process down into seven steps. And I’m gonna go through, in a little bit of detail about each one and talk about why it’s important and how our method can help you.
So the steps are to visualize, to classify the tissues, tissue segmentation, detecting cells, then the actual phenotyping, and then a couple of steps, verify and explore that work together to allow you to check out whether things are the way you expect them to be and to learn about your biology. And then, of course, to publish, to export all of this in a way that’s useful for you. So let’s go through these one at a time. First, to visualize.
Phenoplex opens all major multiplex imaging file formats. It doesn’t matter which kind you use. We can open it.
We can also convert, some nonparameter TIFFs into parameter TIFFs, which is very helpful for large area samples.
And then what’s the next thing you wanna be able to do? Well, you wanna be able to look and see if your data is good. Has it worked well? Can I visualize things in my samples?
And when you’re talking about a forty plex or a hundred plex, it can be a lot of work just to turn on and off channels. So we have a nice way to allow you to set up preset settings of seven colors to be able to switch easily between them and visualize the markers in your sample. You can put more than one marker with a color. In this case, the iridium channels, which are both DNA are in blue, and two tumor markers are in sort of cyan.
And so you can you can easily switch between these, and this helps visualize, say, your t cell subsets or your your tumor, your tumor markers.
Then comes a step that I think people skip, and they often skip it because there’s not a lot of software out there that does it well. And in fact, there’s just to my knowledge, no freeware that does it well. And that’s tissue segmentation. To be able to use the morphology of your sample to divide it into areas for further analysis.
We use a paint to train method. So that means you draw regions on your sample and use those to exemplify the tumor, the stroma, the artifacts, the necrotic region, the things that you want to find in your sample, and then train a deep learning algorithm to find those. You can also train it to find things that you don’t want, folds, bubbles, pen marks, just bad tissue, bad, data, or normal tissue or bone or muscle or something that’s just not involved in your sample. And then once you’ve done that, you can use these, regions, and you’ll see this later as a part of the downstream analysis. We can also, for instance, add bands around that. You want fifty micron zones around, say, an hypoxic area. You can you can build up, regions like that as well.
The next step is to detect cells.
Visiopharm has the industry leading nuclear segmentation algorithms out there, and we’ve done well in every head to head competition we’ve been in. We’ve trained this on hundreds of thousands of cells that have been manually annotated and checked by a pathologist.
And then these are used to build a deep learning classifier, so you don’t have to build one. These pre trained classifiers can be used on, DAPI, so in all the fluorescence modalities and on the DNA iridium for imaging mass cytometry. And what’s really nice about them is if they don’t quite work for what you want for your tissues, for your cells, you can augment them by doing your own annotations, which can then be used to continue the deep learning training and augment that deep learning classifier with annotations from your samples. And if you want, this can include other markers, CD sixty eight, cell segmentation kits like those from Standard Bio Tools, etcetera. So you can use these to improve your cell segmentation.
Once you’ve found all your cells, then you want to be able to phenotype them. This is generally based on how much of each biomarker is present in each of those cells. We have a choice of two methods. One is an automated sort of industry standard unsupervised clustering, similar to what was originally published in HistoCat.
This works quite well, especially for smaller number of markers. But as the number of markers grows, it becomes more and more unlikely that you will get what you want. For instance, for forty markers, there are literally over ten to the twenty two possible combinations of those markers, and statistics at that point are not your friend. So to get around that, we have developed a new method, a guided workflow to help you set the gates to get your best possible phenotypes for your sample.
And so how does that work? Well, this is a manual process. You set the gate for each, biomarker.
How how much are you calling positive? What is negative? What is too positive or overstand?
And you can look at the the cells in the tissue to see which ones are being marked positive or negative. You can look at the histogram of intensities, and you get to look at a cell gallery. So you we we show a display of cells somewhat that are very positive, some that are very negative, and then a bunch that are in between states. So you can see as you adjust these thresholds which cells are turning positive and which cells are turning negative. And there’s a few other tools to go with that to make this an easy process.
Now you’ve got your phenotypes. So now comes the process of checking to make sure you actually have what you think you should have. We have a bunch of tools for doing that. Of course, as I mentioned, the cell gallery.
We also have these tSNE plots, and I’ll talk a bit more about them later. We have an image that will show you all the different phenotypes and how they’re arranged. And we have this really nice biomarker table. You can see it in the middle in blue, yellow, and green.
This shows all the pairwise markers. So if you wanna check to see, like, is your are your CD eight cytokeratin cells done as well as you possibly can? There’s a really nice way to do that. So this really simplifies the verification process of making sure that your your thresholds are set correctly.
If they’re not, you can always step back and fix them.
Then comes exploring. We have a bunch of tools for exploring the cell gallery, looking at the image, and these tSNE plots. TSNE plots are a really nice way to do this. They’re a way to break down all this high dimensional data and show them in a two dimensional image, and then we typically color them with something. The ones in here are colored by phenotype, but I’ll show others later. And we have a nice way of exploring this, and I’m gonna go into depth on this later.
We also have some spatial analytical tools calculating distances between cells and distances between, types of cells and between bound boundaries, and other things like that. So this allows you to count the number of cells in the margin, for instance, or in the stroma and the distances of each cell to that margin.
And then, of course, you can export all these as industry standard images or as a large, tab delimited data file that will load into other software if you wanna further your downstream analysis.
And, of course, what comes with this is something that you don’t get with freeware, and that’s world class service and support. We have a a whole team dedicated to your support.
Software comes with support and you can purchase more. We have these, advanced training classes, training academies they’re called. They’re they’re really quite popular.
Okay. I’d like to spend a little bit more time talking about this interactive phenotype exploration.
It’s really, as the name would imply, an interactive process. So it’s very hard to show in a PowerPoint. But what that means is that the image and the tSNE plot and the cell gallery and even the sub tSNE plots are all linked together. If I circle some cells in the tSNE, I will see where they are in my image, and I’ll see the cells in a cell gallery. I can split my tSNE into subclasses.
In this case, the cells that were in the germinal center, the mantle, or the cytokeratin positive area of this lymph node. These are areas that were just decided through the tissue segmentation earlier. And if I circle cells in the mantle version of the tSNE, I will see where they are in my image.
So what I’m gonna do to explore this is use this one imaging mass cytometry data set. It’s of some pancreatic ductal adenocarcinoma.
We’ve done all of the steps, tissue segmentation, cell segmentation, phenotyping, and now we’ve colored the tSNE plot by the phenotype.
And you can see the the phenotypes on the right. There’s a lot of them in the legend. And I’m gonna use this example to walk through all of this.
So one thing we can do is split this tSNE by what area of the tissue it came from. Were those cells in the stromal compartment or in the epithelial compartment? And so we’ve done it’s called facet buying our software, but we split that tSNE into two linked tSNE plots depending on which tissue class the cells were in. And so if I look at those a little more closely, here they are.
There’s an awful lot of uninvolved cells in this, so I’m just gonna remove the the negative and unphenotype cells. So here’s all the cells that were phenotyped. You won’t be surprised to find that the pinkish and lime green cells that towards the top, are the epithelial cells themselves. So they’re not present as much in the stroma.
And then I’m gonna walk through a little bit about what’s different between these.
And so if I just focus your attention a bit on these two areas, there’s a lot of differences in here, and you can spend a lot of time exploring all this. But I’m just gonna take a look at these two regions.
There are differences in the red circled area and the cyan circled area, mostly having to do with markers that are fairly important for this. T sixty seven, e cadherin c d forty five, meaning their immune cells, and proliferating, which is important. And there are more of those in the epithelium than there are in the stroma.
We can also zoom in on those, and they’re linked, and they zoom in together. So if I take that same graph and zoom in on those two areas that shown here, you can now see even more detail in these parts of the t SNE. And a couple more areas to focus on where you can see some bigger differences. I’m gonna spend a bit of time on the cyan area and then come back to the red one.
And, again, here’s some of the cells that are different.
Phospho ERK and, p d one and site CDK four tend to be the differences.
The green immune cells you can see are actually scattered a fair bit in both the stroma and the epithelium in this area. And then at the bottom right, there’s these pancytokeratin, e cadherin, inos positive cells, that are should be interesting because inos is an important marker in PDAC.
So let’s take a closer look at that. This is where the interactive part with the images comes in. So these are the five regions of interest, the five images from which all this data was taken. Believe it or not, there are little yellow boxes on there that show where the inos positive cells are, but they’re too small to see.
So if I just walk through one at a time, you can see some little yellow boxes in here. Those are the inos positive cells. In this particular ROI, they are almost entirely in normal epithelium, but they’re not even in pancreas. They’re actually in some colon that happens to be in this section.
Here’s two other areas. Again, the inos positive cells are what in what appear to be relatively normal tissue, not cancerous tissue.
Same with these, the inos positive cells, again, are in the ducts, not in the adenocarcinoma area of the sample. So this just shows you that you can take a data set and you can break it down and you can look at what cells are different, but they might not be important to you. These ones happen to have been in pretty benign parts of the sample, which is very good to know.
Okay. Let’s do this on one more example. This is using, some non small cell lung cancer as an example. It’s a thirty core TMA that was stained for eighty protein markers.
So those eighty markers have been phenotyped, and then you can see the legend of some of those phenotypes here. Again, I’m gonna take this one t SNE plot and break it down. In this case, just into each core. So these are the sum of the cores that were in that, sample.
You can see each core has a different set of cells, and each core typically represents a person. Although, in some cases, multiple cores represent the same person, and you could break this down by patient as well. In this case, each core is a person. So we can see that every person’s TSNE is actually a little bit different.
And if we start looking at even more important clinically relevant categories, we’ve broken that TSNE plot down now into the responders and the nonresponders. So these are people who responded to treatment or didn’t respond to treatment. So let’s take a closer look at those. Here’s those TSNE plots of the responders and non responders, and you can see a couple of different areas that are different. And I’m just gonna draw your attention to these two. So HLA Doctor positive, CD sixty eight, CD forty five RO positive, and more of the CD RO positive in the non responders.
This is just the beginning of this analysis. I I’m not gonna go into a lot of depth, and we’re still trying to determine the clinical relevance of this. I just wanted to show you this really useful tool for being able to get to your biology from those images. Because it’s not just enough to collect images and look at how many cells are there. You need to go in and explore where are those cells and what phenotype are they and in what kind of categories are they in. And so this interactive phenotype exploration allows you to dive into that.
So in summary, multiplex pathology is a rapidly growing field, but the analysis, of course, is still problematic.
Phenoplex is something we have developed to help with this. It’s an end to end analysis solution based on deep learning with a whole new workflow for highplex images.
And using the tools that we have to explore your biology has never been easier. This is a part of a lot of investment that Visiopharma is making in this area, so stay tuned for more. And as always, I would like to encourage you all to go forth and multiplex.
Thank you.
In this 18-minute webinar, James presents Phenoplex™, a new workflow solution from Visiopharm for all multiplex image analysis requirements. He outlines the various workflow steps, which efficiently evaluate spatial biology assays with 8-40 or more biomarkers. With its interactive evaluation tools, it enables the extraction of more information from each cell and its relationships.
-
- How pre-trained deep learning-based cell detection for DAPI or IMCTM stains accurately, robustly, and flexibly identifies cells.
-
- The two workflows for phenotyping multiplex and highplex images
-
- How to validate your results using interactive plots that link each data point with the underlying cell

James R. Mansfield, Senior Vice President, Research Business Development, Visiopharm
James R. Mansfield, a scientist with 30+ years of experience, including 15 in multiplex pathology and immune cell phenotyping. He is SVP of Research Business Development at Visiopharm, focused on their strategy for multiplex image analysis. Previously, he was Scientific Director at Magnetic Insight Inc, a start-up in magnetic particle imaging technology. He also held senior positions at Cambridge Research & Instrumentation, Inc (CRi) and PerkinElmer, where he played a key role in commercializing multispectral imaging for pathology.