Using Visiopharm to support image analysis workflow QC and trust in data
Using Visiopharm to support image analysis workflow QC and trust in data
Delivering high-quality, quantitative data from digital pathology images is one of OracleBio’s core values. Tools such as Visiopharm enable us to achieve this by building robust, AI-powered image analysis workflows.
In this masterclass, we explore the QC strategies used to ensure accuracy and reproducibility in the following case studies:
- The creation of a pathologist-validated and scalable image analysis workflow for a retrospective clinical study involving over 2,200 IHC-stained colorectal polyp whole slide images.
- The use of Deep Learning apps to segment morphologically distinct cell subpopulations and the Phenoplex workflow to streamline the thresholding process for spatial phenotyping in multiplex IF-stained pre-clinical tissue.
Karen McClymont, Image Analysis Project Manager, OracleBio
With a PhD in Biochemistry and her active involvement and support in the analysis of some of OracleBio’s most complex studies, Karen plays a key role leading OracleBio’s image analysis projects and overseeing the team’s continued development.

Gabriel Reines March, R&D Project Manager, OracleBio
With a PhD in Biomedical Image Processing and a background in Electrical Engineering, Gabriel is the OracleBio R&D team lead. He oversees and manages the group’s project pipeline and ensures that the company stays at the bleeding edge of the industry.
Gabriel also manages OracleBio’s involvement in the INCISE project – a collaborative effort between industry, academia and the UK’s National Health Service.
Mapping the biological landscape: Turning multiplex images into knowledge

Spatial biology is revolutionizing molecular biology by enabling the examination of cells within their tissue microenvironment. It empowers scientists to reconstruct tissue structures and compartments and investigate intricate cell-to-cell interactions and dependencies. This level of detail is unparalleled by any other available method. The resulting multiplexed images require easy-to-use image analysis tools that are tailored specifically for biologists and pathologists. In this masterclass, we illuminate the significance of spatial biology in modern research, unveiling its potential to revolutionize our understanding of biological processes and disease states.
We will discuss its capacity to unveil hidden biological nuances and disease mechanisms within tissue landscapes. Emphasizing the practical needs of biologists and pathologists, we will delve into:
- Image visualization and quality control.
- Tissue segmentation strategies to delineate anatomical regions and tissue compartments accurately.
- Cell segmentation, both turn-key and enhanced.
- Phenotyping for characterizing cellular populations and discerning pathological features.
- Spatial neighborhood analysis tools, illuminating the spatial relationships vital for understanding microenvironmental influences.
- The demand for interactive data interrogation platforms, facilitating intuitive exploration of results and hypothesis generation.
Join us as we navigate the complexities of spatial biology and multiplex image analysis, empowering biologists, and pathologists to decode the mysteries concealed within biological landscapes. By bridging the gap between images and insights, Phenoplex equips researchers with the tools to navigate and understand the complexities of biological systems with precision and clarity.

Dr Fabian Schneider, Product Manager Research, Visiopharm
Dr Fabian Schneider is part of Visiopharm’s R&D and Product Management team, responsible for phenotyping products as well as service projects for custom APP development. Fabian has over 10 years of international experience in cancer biology and immuno-oncology, working in academic research labs, clinical research teams and computational pathology groups in both academia and biopharma.
Fabian received his Dr phil. nat. in Cell Biology in 2011 from the Johan Wolfgang Goethe University Frankfurt, Germany.
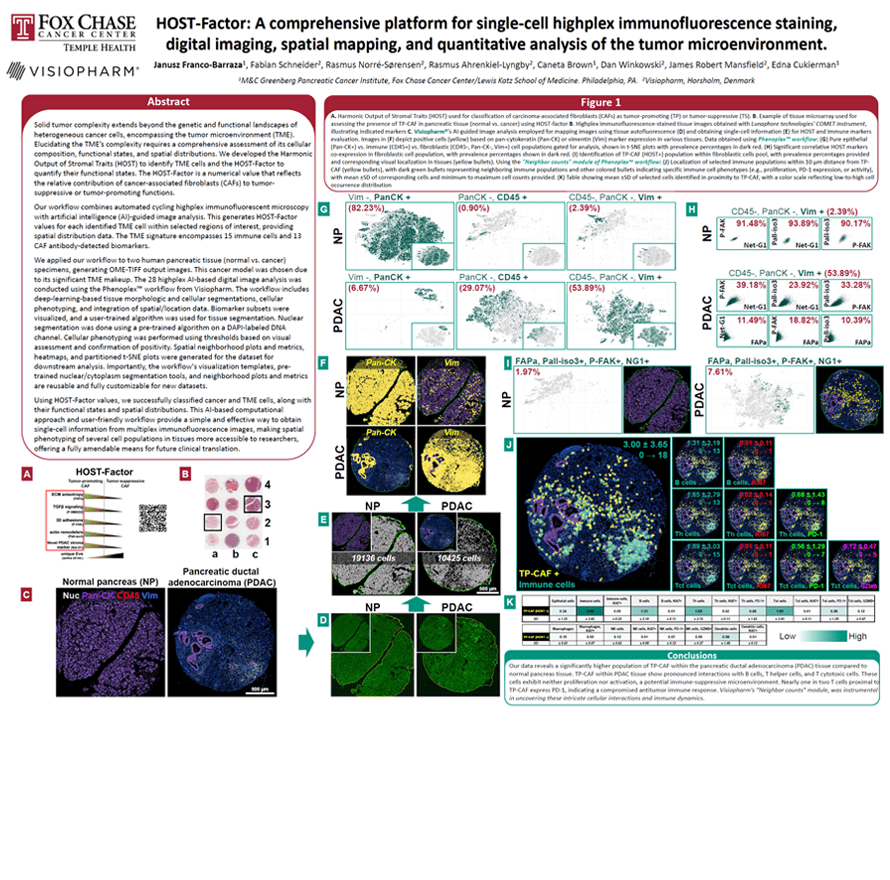
Solid tumor complexity extends beyond the genetic and functional landscapes of heterogenous cancer cells, encompassing the tumor microenvironment (TME). Elucidating the TME’s complexity requires a comprehensive assessment of its cellular composition, functional states, and spatial distributions. We developed the Harmonic Output of Stromal Traits (HOST) to identify TME cells, and the HOST-Factor to quantify their functional states. The HOST-Factor is a numerical value that reflects the relative contribution of cancer-associated fibroblasts (CAFs) to tumor-suppressive or tumor-promoting functions.
Our workflow combines automated cycling highplex immunofluorescent microscopy with artificial intelligence (AI)-guided image analysis. This generates HOST-Factor values for each identified TME cell within selected regions of interest, providing spatial distribution data. The TME signature encompasses 15 immune cells and 14 CAF antibodydetected biomarkers.
We applied our workflow to two human pancreatic tissue (normal vs. cancer) specimens, generating OME-TIFF output images. This cancer model was chosen due to its significant TME makeup. The 28 highplex AI-based digital image analysis was conducted using the Phenoplex workflow from Visiopharm. The workflow includes deep-learning-based tissue morphologic and cellular segmentations, cellular phenotyping, and integration of spatial/location data. Biomarker subsets were visualized, and a user-trained algorithm was used for tissue segmentation. Nuclear segmentation was done using a pre-trained algorithm on a DAPI-labeled DNA channel. Cellular phenotyping was performed using thresholds based on visual assessment and confirmation of positivity. Spatial neighborhood plots and metrics, heatmaps, and partitioned t-SNE plots were generated for the dataset for downstream analysis. Importantly, the workflow’s visualization templates, pretrained nuclear/cytoplasm segmentation tools, and neighborhood plots and metrics are reusable and fully customizable for new datasets.
Using HOST-Factor values, we successfully classified cancer and TME cells, along with their functional states and spatial distributions. This AI-based computational approach and user-friendly workflow provide a simple and effective way to obtain single-cell information from multiplex immunofluorescence images, making spatial phenotyping of several cell populations in tissues more accessible to researchers, offering a fully amendable means for future clinical translation.
Janusz Franco-Barraza1, Fabian Schneider2, Rasmus Norré-Sørensen2, Rasmus Ahrenkiel-Lyngby2, Caneta Brown1, Dan Winkowski2, James Robert Mansfield2, Edna Cukierman1
1) M&C Greenberg Pancreatic Cancer Institute, Fox Chase Cancer Center/Lewis Katz School of Medicine. Philadelphia, PA.
2) Visiopharm, Hørsholm, Denmark
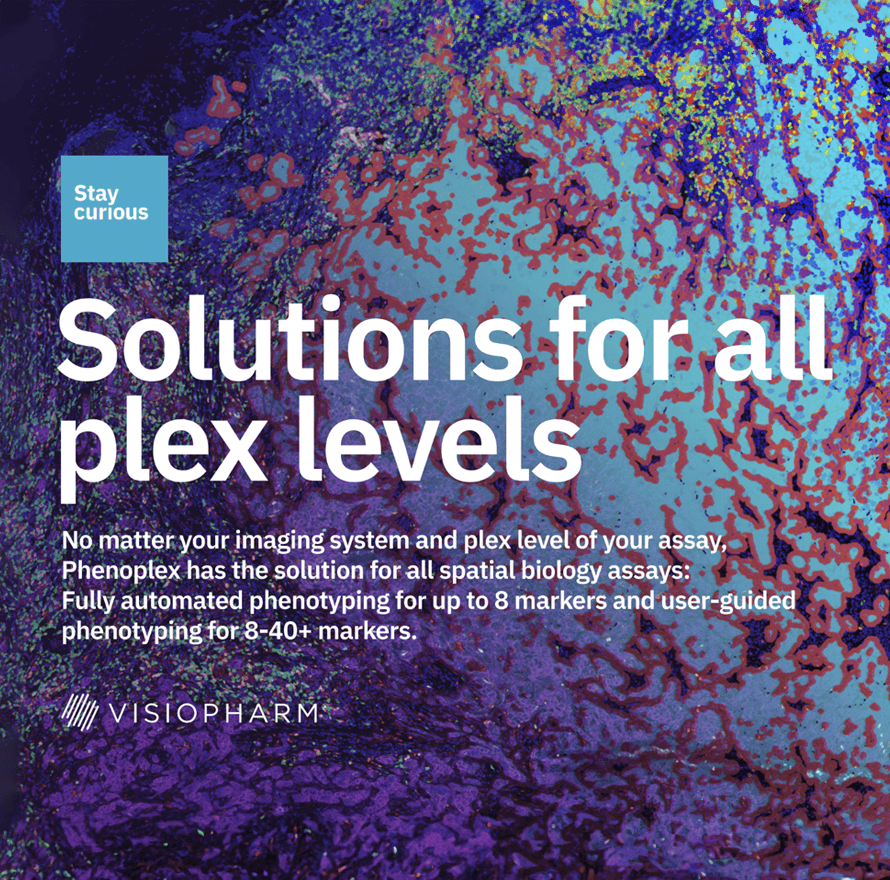
No matter your imaging system and plex level of your assay, Phenoplex has the solution for all spatial biology assays: fully automated phenotyping for up to 8 markers and user-guided phenotyping for 8-40+ markers.
Classifying cells into phenotypes is typically done by biomarker expression. Unsupervised methods rapidly
generate data, but rarely allow the expert biologist to influence or provide the feedback necessary to check
the results.
Phenoplex’s guided phenotyping, on the other hand, works with the biologist to assess each biomarker within the multiplex images using a variety of cooperative tools at each decision point.
Visualize, analyze and phenotype multiple images at the same time
The Interactive Multiview Analysis allows you to perform semi-automatic image analysis across multiple images simultaneously. Set thresholds for biomarker positivity across multiple images. Check data heterogeneity and review your images with a synced zoom factor.