Transcript
Thank you, Lars, for the kind introduction.
Today, I want to show you the phenotyping cell population capabilities of multiplex images using our Visiopharm platform.
For this, I prepared a short talk where I want to give you an overview over the platform capabilities, show you an example image analysis of an 8-plex, how we did it from an Ultivue IO 8-plex, and then give you a very brief peek into our product roadmap, show you what’s ongoing now in our r and d team and what we have planned next and later.
Let me briefly introduce you the Visiopharm platform.
The Visiopharm platform is an easy to use toolbox for image analysis scientists and you can use it across all modalities of images and even file formats.
All outputs that you would like to generate are fully customizable in the iApp or the module and no coding is required, which is great for biologists like I’m You can extend your platform with modules like tissue array where you can de array tissue microarrays and give each core an individual analysis.
You, can extend it with multiplex phenotyping, what we will be talking today about.
You can use, the tissue aligned module to align serially cut sections and to, virtual multiplex stains if you have several of your stains in in order.
And you can use, the deep learning platform, that we are having by extending your core platform with AI engine and AI author.
Several reasons exist why you want to use multiplexing technologies for the analysis of your samples. And the first is that you would like from corneal biopsies, for example, where you only have a minimum amount of tissue. You want to use it for the maximum readouts.
And other omics data like, NGS are using a lot of these materials. So for immunofluorescence or site of imaging, you only have a bit left.
Then you would like to know, in contrast to NGS, where are these markers and how are they distributed? And this is especially important since the breakthrough of immuno oncology, as we all know, where we need to know where are my lineage markers and which lineage markers are present. So is it a cold tumor? So is it absence of, cytotoxic T cells?
Is it a hot tumor?
Do cytotoxic T cells invade the tumor epithelial area?
And which functional markers do these, cells carry? So are they even capable of, being cytotoxic? Like, do they have granzyme b and perforin one?
Are there a lot of regulatory T cells inside the my tumor?
Are my T cells proliferating inside the tumor area and get therefore activated?
Or do the tumor cells, have glucose transporter three and therefore are highly metabolic?
The best known immune oncology checkpoints and the ones that are also clinically proven, are CTLA four, PD-L1, and PD-1. And we all know them. And in the clinical pipelines, there are further checkpoints like TIGIT, VISTA, AUX40, Luxury, TIMSSRI, and many more.
And many of these will require CDX tests.
And one great way to identify these new tests is to use multiplexing technologies to identify biomarker signatures, to test if you can already use existing, biomarkers, or if you have to, develop new CDX tests.
When you want to analyze your multimodal images, you need to undergo several steps that you can either do in several softwares or in our platform in in one workflow.
So you need to do tissue segmentation.
You need to do a robust cell segmentation that accounts for the different sizes in the tumor or tissue microenvironment of your different cells.
You need to do the phenotyping, so you need to have the mask of your cells and use the underlying channel information to get to all the phenotypes.
You need to be able to give spatial readouts and intensity readouts and XY positions, and you need to be able from the platform to export these data for downstream on statistical analysis.
And our workflow is that you can use this in an app sequence, where in the first app you do the tissue segmentation, in a second app you do a robust cell segmentation, and in a third app you would do the phenotyping individually for the essay that you, and the marker combination that you’re using. And then you can do the data export.
So taken together, VisioPharm phenotyping offers you a combination of machine learning and AI deep learning for tissue and cell segmentation, automated phenotyping, setup of output classes classes to your needs, and also the export of all raw data.
As a scientist you will have the first question for your samples is what’s the phenotypic landscape in my sample? And there you are interested in the cell types and their interactions. So where are my phenotypes and where are they interacting exactly?
What is the phenotype distribution inside the sample? And is it in which compartment is it?
Then you can do the hotspot cluster analysis with our software by applying heatmap functions.
And another important thing is that you would like to know where are the phenotypes that have the receptor and the ligand, pairs present and where are these located inside the tumor and how frequent is that.
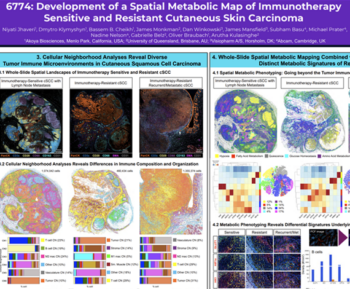
The example in which I would like to show you the analysis that Yapith Ogod and, and I did on a Ultiview eight plex image. It’s an it’s a product from Ultivue that’s called Ultimapper IO immuno-eight and has, the T cell landscape by adding CD3, CD4, and CD8.
So you know the distribution of cytotoxic and T helper cells. You have CD68 for macrophages, FOXP3 to know where the T regulatory cells are, and as functional markers you also have PD-1 and PD-L1, so the axis, and you can have a segmentation for, set to cytokeratin for epithelial cancers or Sox10 for melanoma cells.
And if you plot all of these, markers in a matrix and give them a biologically relevant name, Then we get to a list of more than twenty phenotypes that you can, identify out of this panel.
And I would like to focus here on the cytotoxic T cells and the exhausted prime cytotoxic T cells with the presence of PD-1, the macrophages and immunosuppressive macrophages from the M2 lineage expressing PD-L1, and the same for tumor cells.
The first thing in the app sequence is that you need to, detect tissue and do your, tissue compartmentalization.
So for this, we have used an app for the tissue detection in green and then did a manual drawing of the region of interest for the delineation of the tumor versus host tissue. And that can also be done by an expert pathologist, either directly on the MIF images or on an H and E image that, Altiview, kits allow to do an H and E in the end. And then you can transfer the annotations from the H and E onto the masks of the IF channels.
Then next would be that within your region of interest, so your tumor annotation, you would do your tissue segmentation by segmenting your cytokeratin positive tumor cells here using the keratin layer, from the IO eight plex. But you can also train a deep learning, classifier to detect the tumor, cells versus the stromal cells.
When visualizing eight markers at once, it’s almost impossible for me to understand what is going on in this cancer case. So when we are zooming in and look at only the lineage markers, we can see that the tumor is delineated and almost shielded from other cells with, a line of CD sixty eight positive macrophages, CD four expressing T helper cells, and intermingled in between, you have CD eight. And the CD eight are also recognizing, as it seems, the tumor and are invading into the tumor epithelium and maybe doing their job by, killing the cancer cells.
When in this, spot, we are doing now the cell segmentation and therefore doing AP number two. So here we have already done the nuclear segmentation and now did already the dilation of the cells to, show the whole body of a cell.
And when we are then adding apps three on top, then we can do the, phenotyping.
And here we have already started phenotyping the lineage markers, and this is a similar image to what we have shown in the beginning. But now we have already implemented one functional marker, which is FOXP3, to show us the t regular cells here in blue.
And when we add the other two membrane, markers, PD-L1 and PD-1 for the functional system, then we can, mark them, for example, by only showing them within the cytoplasm of the of the image object that we have identified. So in red, you see PD-L1. So you see a lot of PD-L1 expressing macrophages.
You see, in this light green PD-1 expression, and there you see that a lot of your CD8s are expressing PD-1, and that all of the that a lot of that many of these CD8s that are on the tumor epithelium or within that they are also expressing PD-1.
To reduce the complexity of this cell segmentation, which is also overwhelming for my eyes, you can, only show, for example, these dots. And if you then remove all your image channels or do it with only one, then you can look at this distribution of all these beautiful colored, boxes.
And then it’s much more easy for me as a human to understand where are my CD8s and that they are really and clearly trapped on the one hand outside of this, line of PD-L1 expressing macrophages. And then you clearly also have them inside of the tumor epithelium.
After we were done with the basic image analysis and had all the phenotypes, and we wanted to know where are these phenotypes of the macrophages, so the CD68s and my, cytotoxic T cells and where are they, within the whole tissue? Are they homogeneously distributed or not? So cytokeratin, just as a layer mask for you to visualize where is the cancer, shows that the CD3, CD8 are mostly kind of homogeneously distributed within the tumor epithelial areas and around it and have this one very, very dense high spot.
So to understand the legend is that the yellow areas mean that we have a density of around three hundred cells per square millimeter.
When we add the functional markers, we see that we only have down here in this spot of the CK, we have, PD-1 expressing cytokeratin positive tumor cells.
While we have in the same area also a hotspot for CD68 PD-L1 positive cells.
And we have all the tumor epithelium seems to be delineated with these, M2 like macrophages.
The PD-1 expressing cells are less than the total CD8, but that was also expected from me.
And you see that the hotspot for the PD-1 is the same as for the total CD-eight on this tumor and that the distribution of the PD-1 double triple positive CD-eight is, more on the tumor epithelium than in the surrounding.
Another very nice feature of the heat maps is that you can combine outputs. And here we combine the total PD-L1 with CD8, CD3, PD-1 triple positives.
And what we see is that we have, three clear hotspots for, the co localization of these sets.
To deep dive even further into into your data is that you export with all of these segmentation areas, all your numbers, into a TSV file. And then we have imported this into Excel here in this case, as you see from the visualization, and did a very basic analysis of this case.
So what we have already seen is this this case is rather a hot one, but it has definitely more T cells in the stroma than on the tumor epithelium.
You also see that what we have seen within these heat maps is also true within real numbers that you have more CD8 PD-1 expressing cells on the tumor epithelium than in the stroma. While you have more immune suppressive cells like regulatory T cells or, PD-1 expressing, macrophages in the stroma than within the tumor epithelial areas.
Another very nice way to visualize this is using the radar plot functionality and where you then clearly see this shift of the CD three, CD8 towards this, with PD-1 expression towards the tumor. And if you put on the other axis the CD68 PD-1, so the opponent of the PD-1, then you see that these are clearly located in the stroma.
We can also look at the less abundant cells within these regions of the tumor epithelium versus stroma. And there we see, for example, that we find CD8s that express FOXP3, but more inside the stroma than on the tumor epithelium.
We also find CD4, CD8 double positives and even triple positives with FOXP3.
The invasive margin around tumor epithelial nests and buds is of high importance to understand where are your, immune cells that are attacking the cancer are located, and can they even move close to it.
So here we added two fifty micron margin zones to the epithelial delineation, one inner and one outer.
So and when you look at these tumor epithelial margin zones, you can, for example, ask yourself, where are the CK positive cells? Are they only within the the tumor, epithelial area or are they even tumor buds that are migrating away from the tumor mass and therefore leading to a much more aggressive and invasive phenotype of the tumor.
And what you see here clearly is that the further away you get from this tumor, the more c k the less c k positive cells you find, but you find them.
We then exported also this area and did the, data analysis of our phenotypes of the the of the main phenotypes within these regions. And what we clearly see is that the closer you get to the tumor, the more CD8 PD-1 double expressing cells you find.
And it’s a bit different for the CD68 PD-L1. So the immune inhibitory macrophages.
So these are more abundant in the outer margin and the inner margin and less abundant in the tumor epithelial area itself.
As said in the introduction is that one of the things that we are also interested in with this case is where are the cell cell contact and the direct cell contact.
So when you do your tissue segmentation and cell segmentation, you can, for example, then identify all the CD8s here shown in pink.
And if you then only subset those cells that are in direct contact, so that are closer than, for example, two or three micron, then you can generate a new output class for these and export them. And then, for example, generate, this MLD file where you see all the all the cells that are in direct contact. And then you can sub phenotype that. So you can say direct contact with CD8 PD-1 expressing cells, for example. And then we will see that most of them are in contact with, CD68 or PD-1 CD68. A lot are in contact with CKs and so on and so on.
On top of our high end quality image analysis, we also deliver, visualization tools for your phenotype results.
So for example, you can visualize your phenotypes with the tSNE dimensionality reduction plotting, where you then can look, for example, at two different cases and their distribution of the phenotypes or pre and post samples.
You can look at the total phenotype profile by, by this, phenograph where you see, like, a bar graph from top where you see the expression.
Or you can look at the neighborhood analysis of your, different, cell types.
In in summary, what I’ve shown you is that with the Visiopharm platform, you have a flexible toolbox at hand to generate the apps based on a workflow as shown below for almost all image file formats in multiplex, IF.
By using the deep learning module for tissue and cell segmentation, you have a very powerful tool at hand to train by the examples and your examples.
This workflow fully integrates with the multiplex phenotyping module for an automated pheno clustering, and all the outputs that you would like to generate on top of your phenotypes are fully customizable to answer your biology questions.
With this, I’d like to thank you all for your attention.
And I would like to thank Ultivue for providing us with the image of the IO eight plex of the CRC case, and Jeppe for, spending his time on doing the image analysis together with me and developing this talk.
Alice his team, Alessandro, Rasmus, Andreas, and Simon for, the hard work that they are putting into the update of the phenotyping product. And I would like to thank David and Jim for input for this talk. And I’m looking forward to your questions and discussion.

Dr Fabian Schneider, PhD, Service Project Lead, Visiopharm
Dr Fabian Schneider is part of Visiopharm’s R&D and Product Management team, responsible for phenotyping products as well as service projects for custom APP development. Fabian has over 10 years of international experience in cancer biology and immuno-oncology, working in academic research labs, clinical research teams and computational pathology groups in both academia and biopharma. Fabian received his Dr phil. nat. in Cell Biology in 2011 from the Johan Wolfgang Goethe University Frankfurt, Germany.