
Transcript
Hello, everybody. Welcome back to our masterclass series on the challenges of IoT staining. Thank you for joining us every week this January. I’m Bettina Winkler from Visiopharm and today we have Regan Fulton with us who will talk about Ki-67, its clinical usage and the challenges in standardizing the IHC assay.
Regan is a board certified anatomic pathologist and is the founder and CEO of Array Science, a manufacturer of control and proficiency testing material.
As always, please add your questions to the chat. Regan will answer those after the talk. Off to Regan to start the webinar.
Hello. I’m very pleased and honored to be speaking with you today about standardizing Ki-67 immunohistochemical assays using cell lines.
By way of an outline, I’ll be spending some time talking about the protein function of Ki-67 as well as its clinical utility.
And then talk about some of the problems of assay reproducibility.
And provide some comments about controls including tissue, cell lines, and others that represent some promising tools for improving assay reproducibility in the future.
It has been a slow process to discover the functions of this nuclear protein, but it seems to have multiple activities involving organization of the chromatin, splicing of RNA, control of transcription, as well as others.
The Ki-67 protein is a widely used marker of cell proliferation that is expressed in all stages of the cell cycle except G0.
It was originally described by Gerdes et al. In nineteen eighty three and the protein was assigned the name of the antibody that reacted with it in frozen sections.
The original Ki-67 antibody didn’t work in FFPE material.
Subsequently, other antibodies were generated including MIB1 and these were reactive in FFPE tissue.
MIB1 has become the most widely used anti Ki-67 antibody.
While other clones such as thirty-nine, sp6, K2, and MM1 have a smaller but growing presence. During mitosis, chromosomes have a dense coating of Ki-67 protein on their surface.
Ki-67n is a non histone protein that appears to act as a surfactant, allowing chromosomes to maintain discrete conformations in the condensed state.
In vitro experiments with cell lines deficient in Ki-67have shown that the absence of Ki-67 coding, chromosomes turn into an amorphous mass at metaphase.
The human Ki-67 gene is very large and encodes multiple functional subunits.
A characteristic repeated sequence, the FKELF motif, is present in sixteen copies.
Nine of which encode targets of the MIB1 antibody.
A chromosomal interacting region called the LR domain includes the epitope to which the thirty dash nine antibody interacts.
The series of immunofluorescence images shown in this slide reflects the intercellular location of Ki-67 in various stages of the cell cycle.
Chromatin is highlighted in the blue DAPI stain. And as you can see, Ki-67 forms a portion of the perichromosomal layer in mitosis, where it is thought to act as a surfactant maintaining the chromosomal organization during this phase.
Detectable Ki-67 decreases throughout G1, where ultimately localization appears to be limited to the nucleolar region.
In G0, the expression of Ki-67 is markedly decreased and the degradation of the protein is increased, making it undetectable at that stage.
In this live action video combined with immunofluorescence, we see mitotic cells and culture demonstrating the process dynamically.
Midway through the video, a mitotic inhibitor is added and the effects of entering a quiescent state are clearly seen in the loss of Ki-67.
Quite surprisingly, there are now multiple reports that despite the various functions of the Ki-67 protein that are so far described, knockout cell lines actually survive and proliferate.
And Ki-67 knockout mice also appear to develop normally.
This is probably worth repeating. Ki-67 knockout mice have been reported to develop normally and cells lacking Ki-67 proliferate efficiently.
Now this research bears repeating to confirm, but it is certainly surprising in light of what we know about Ki-67.
And yet Ki-67 has been shown to have clinical utility.
Estimating the proliferation rate, whether by counting mitoses or by IHC, is a common component of tumor classification.
Mitotic counts are integral to grading breast carcinoma, uterine smooth muscle neoplasms, and many others.
As a marker of proliferation, IHC assays for Ki-67 have great advantages over counting mitotic figures, both in terms of the time required and the degree of ambiguity.
The latter also makes Ki-67 interpretation more amenable to digital image analysis.
Ki-67 is now used to characterize a wide variety of neoplasms including meningiomas, breast carcinomas, neuroendocrine tumors, and lymphomas, among others.
While Ki-67 is the most familiar biomarker of cell proliferation, others also exist.
PHH3 or phospho histone H3 has shown promise as a more specific marker of mitosis because the epitope is present only during the mitotic phase when the histone H3 is phosphorylated.
Additionally, the PHH3 epitope is not present in apoptotic cells, which may be an advantage over Ki-67 which is present at that stage.
Additional markers such as ORCA, PLK1, GMNN1, and MCM2 have also been examined recently.
These are not yet in common use for clinical applications.
But in one study, ORCA appeared to perform better than Ki-67 at predicting outcomes in ER positive breast cancer.
Much more study will be required for newer markers to displace Ki-67 as the proliferation marker of choice, but it’s worth keeping an eye on this space.
Phosphohistone H3, as I said, is more restricted in its expression, specifically to the mitotic phase. And it’s demonstrated amply here in this figure where a highly mitotic and proliferative breast cancer is shown as stained with phospho histone H3 above and Ki-67 below.
As you can see the Ki-67 proliferation index is much higher than would be reported with phosphohistone H3.
Getting back to Ki-67 specifically, one routine application is the WHO grading of neuroendocrine neoplasms of the GI tract. Wherein grade one neuroendocrine neoplasms have a proliferation index of less than three percent.
Grade two NEMs show proliferation indices of three to twenty percent.
And grade three neoplasms show greater than twenty percent Ki-67 proliferation indices.
Thus the Ki-67 results carry significant prognostic and therapeutic implications and are expected to be very accurate and precise. And as we’ll see in the upcoming slides, this presents a very real challenge.
Given the stringent and tight thresholds for Ki-67, particularly in neuroendocrine neoplasms, but also in other contexts, assay reproducibility of IHC for Ki-67 is of particular concern.
In this report from NordicQC, the Ki-67 assay parameters used locally are quite variable and they report on the impact of primary antibody clone, format, stainer platform, and other parameters on the proliferation indices in breast carcinomas.
They find that there are significant variations in the proportion of tumors with high Ki-67 expression that is greater than or equal to twenty percent based on these parameters, the antibody, the format, and the stainer platform combinations.
They conclude that to advance the usefulness of Ki-67 proliferation indices in research and clinical settings, standardization of IHC assays is needed.
Now as a reminder, the assays themselves are laboratory developed tests. And it’s not been clear what controls should be used to calibrate these assays to assure optimal sensitivity.
Ki-67 antibody clones show variable sensitivity and some antibody instrument pairings may be suboptimal.
Other protocol parameters including retrieval method, detection chemistry may also contribute to variable results.
An additional frustration is the lack of consensus about how to score Ki-67 assays as we’ll look at in a moment. Does one concentrate on hotspots or integrate the whole sample? Should we report the number of positive cells by unit area? Or as a percentage of tumor cells, how many cells should be counted?
What constitutes a positive cell?
Should digital image analysis be employed?
All of these remain open questions in this field, although increasing intention is being focused on the problems.
Despite the lack of standardization and the variability in the cut points used to define a high Ki-67 index from five to thirty four percent or more, the prognostic and predictive value has been demonstrated in a majority of studies.
The St. Gallon consensus of two thousand and nine proposed three categories: low, intermediate, and high, with thresholds at sixteen and thirty percent. In twenty eleven, the categories were changed to a single cutoff of thirteen percent between luminal A and luminal B type categories of estrogen receptor positive tumors.
In twenty thirteen, the St. Gallen consensus revised again the threshold for low and high proliferation.
This time arriving at twenty percent proliferation rate as measured by Ki-67.
Finally in twenty fifteen strict thresholds were abandoned altogether and it was left to local laboratories to determine what the median expression level of Ki-67 in their ER positive tumors would be. And then low expressors would be defined as ten percent less than that median and high expressors ten percent more than that median value.
And as of twenty twenty three, the NCCN guidelines do not recommend Ki-67 assessment of breast cancers in clinical practice.
But we might look to estrogen receptor as a model for how Ki-67 IHC assays can be improved over time and become consistent and robust enough for use in clinical practice.
In this additional report from Nordic QC, taking a look at lessons learned in estrogen receptor testing, it becomes apparent that the standardization of protocols in the time frame of two thousand and three to twenty twenty one has resulted in the improvement of the pass rate for staining quality from fifty percent to eighty nine percent as assessed centrally and staining performed locally.
This corresponds to increasing use of ready to use antibodies from seventeen to eighty eight percent over that time period. Increasing use of high pH retrieval and polymer detection.
And remarkably, an increase from four to eighty nine percent of laboratories reporting fully automated staining platforms.
In light of all the variation in Ki-67 assays, from pre analytic through interpretive phases, an august group of experts led by Torsten Nielsen has taken up the challenge and assembled an international Ki-67 in breast cancer working group.
They’ve spearheaded educational efforts to reduce scoring variability among expert pathologists in a series of published studies.
In their series of studies implementing increasing levels of standardization through local staining and centralized staining with training, visual scoring of cores versus excisions, and implementation of automated scoring.
They demonstrate a marked increase in agreement among laboratory experts as measured by intra class correlation coefficients, as shown on the vertical axis, across the series of increasing levels of training and standardized methods.
Part of the training focused on the definition of a positive cell, while other aspects of cell counting were also addressed.
In this example, the recommendation is to score cells with any detectable nuclear staining regardless of the Ki-67 localization.
I would direct your attention to the small red squares from the left upper to the right lower panel.
And note that the low level expression is such that it would probably escape the notice of most practicing pathologists.
In 2021, there was a momentous occasion when Dako agilant introduced a companion diagnostic Ki-67 assay for determining eligibility for Virzenio or Abemiciclib, which is a CDK4/6 inhibitor.
The assay is scored as low (less than twenty percent ) versus high (greater than or equal to twenty percent ) with selected breast cancer patients in the high category being eligible for the treatment. The scoring is based on an eyeball estimation.
And despite some controversy with the validity of the clinical context in which this was developed, one could argue that a locked down assay could result in a new gold standard against which Ki-67 laboratory developed tests could be compared.
A complexity arises when we examine the interpretation guide from the Docco companion diagnostic assay.
On the left hand panel you can see green arrows pointing to positive cells meeting the threshold for intense staining with Ki-67 antibody MIB1.
Whereas the black arrows are meant to indicate cells that don’t meet the threshold for positivity.
However, if you recall from the international Workgroup on Ki-67 in breast cancer guidelines for interpretation, any degree of staining with Ki-67 in the nucleus would be called positive. So the two interpretation schemes are in conflict. And further, if you notice on the right hand panel, the daco assay specifically excludes any staining that is restricted to the nucleoli.
And again, this is a difference from the original instructions that I showed you earlier. So from an analytical standpoint, an FDA approved companion diagnostic may represent an opportunity for standardization.
We still have to come to some agreement about how to interpret such tests.
Nonetheless, in March of twenty twenty three, the FDA expanded the indication for a Beamiciclib to all patients with hormone receptor positive HER2 negative node positive early breast cancer at high risk of recurrence based on these clinical findings. And this is out the requirement of having a high Ki-67 score. So the most recent approval removes the requirement for KI67 testing.
So the need to standardize laboratory developed tests for Ki-67 continues.
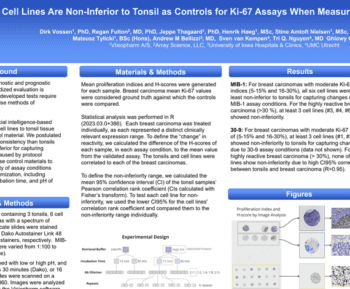
And recently David Rym at Yale developed a novel idea for a cell culture based IHC control that involves the titration of a positive cell line into a negative background in a precisely controlled gradient for comparing the sensitivity of different Ki-67 assays.
And I was privileged to be invited to collaborate on this study that I’ll present to a limited degree now.
The negative cells that David chose were based on an insight that while all mammalian cells are capable of producing Ki-67 in non G0 states, other species might serve as negative cells in this context.
He settled upon the well known SF9 cell line derived from the fall armyworm, Spodoptera frugiaperta.
And this cell line is indeed negative for Ki-67 reactivity by IHC, with the exception of the little used antibody MM1 that seems to show some cross reactivity with an unknown antigen under certain conditions. But it does appear to be platform and retrieval specific.
As a positive cell line, highly proliferative T cell lymphomas, either carpus or jerked, were utilized.
These are approximately seventy and one hundred percent positive respectively.
The mixtures were made of either carpus or jerked as I said with SF9 cells as a background.
The positive cells were mixed in at increasing concentrations of zero, five, ten, twenty, thirty, and one hundred percent.
After usual processing into FFPE, microarray blocks were constructed with triplicate cores of each concentration and subjected to staining by IHC with different assays.
Shown in these two panels are performance of various Ki-67 clones within a single laboratory.
And as you can see reading from left to right, there is a decreasing sensitivity or proliferation rate as measured by Ki-67 positivity from antibody 1297A down to MM1 in this laboratory.
Now that’s not consistent because as you can see in panel B, interlaboratory concordance with a particular antibody, in this case MIB1, was very poor.
With lab one in the middle, lab two showing much higher sensitivity and in the range of expected, while laboratory three had very significant problems with sensitivity.
We extended the study to include parallel staining of the standardization cell culture microarray with a TMA with clinical samples including triple negative breast cancers of known clinical outcome using the antibodies MIB1 and 1297A.
In this laboratory, 1297A had about half the sensitivity of MIB1.
Now after normalization of the 1297A results to MIB1 using the standardization array as a calibrator, there was an increase in the proliferation indices of 1297A such that thirty eight versus twenty two patients were now identified in the high category, which created a significant association of high Ki-67 expression with worse survival.
So this application demonstrates the value of a standardization system for different antibody clones, but it could also be used for different laboratories and different operators.
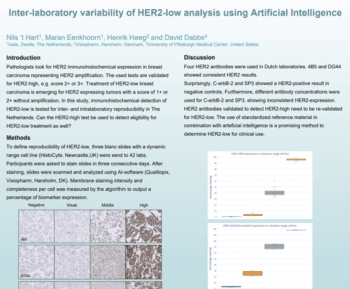
When this standardization tool was used by an external quality assurance proficiency test with one hundred and forty five participants, the median values shown in blue were very close to the intended values.
But remarkably, the low and high values shown in orange and gray respectively were remarkably broad in their range suggesting that some assays were very very weak and some assays were showing nonspecific staining and were too high in the perceived or interpreted proliferation rates. Very similar results were seen in a separate proficiency testing survey for Ki-67 administered by UK NEQAS and presented at the San Antonio Breast Cancer Symposium.
Note again the closely clustered mean values and yet there’s still this broad range of results from individual labs. So the error bar is indicating a wide range of reactivity.
One issue with the cell mixes is that there is a limited range of intensity inherent in the positive cells, particularly JERKAT.
And only a very weak assay would fail to detect all of the positive cells.
As such, this model has a limited range of sensitivity measurement and is better suited as a control for the interpretive or counting aspect of the assay.
To address the issue of sensitivity with greater precision, additional cell lines have been developed for the purpose and these cell lines have a broader expression profile of Ki-67 with an AgMixture of low, medium, and high expressors.
Now these are pure cell lines that show varying degrees of intensity rather than cell line mixes.
That broad intensity is seen at higher magnification here. On the left, that’s the DAB chromogen. On the right is a superimposed mask of digital image analysis interpretation of negative, low, medium, and high expressor cells.
That’s the same image.
And with this broader intensity profile, you can imagine that analytic sensitivity of a well optimized assay would look something like what is shown in this schematic.
Whereas a less well optimized assay would lose populations from each of those categories until a poorly performing assay would show very few of the intensely staining cells and so on, such that the proliferation indices would be much reduced.
And finally, a total assay failure as detected and depicted here would fall into the category of a system control, and so this can serve both for sensitivity and as a system control.
Now the utility of such controls is predicated on the concept that a culture of a particular cell line will show a mean proliferation rate, which when sufficiently mixed and evenly distributed will show equivalent numbers of positive cells from one section to another throughout a batch.
This makes assay comparisons and sensitivity monitoring feasible. And we have confirmed this hypothesis with multiple internal studies showing the consistency of the distribution of positive cells within our preparations.
This is also the case with EQA schemes utilization of this material.
Now as an example of the utility of the tool beyond EQA schemes comparing sensitivity of assays, one can implement for daily QC or longitudinal sensitivity monitoring.
The application of the Westgard rules for example for assay rejection that might necessitate repeat or additional troubleshooting include one instance of an assay where the values are outside three standard deviations of the expected mean, as is depicted in this schematic graph.
And I should say that this data actually was generated from sending out this material to a reference laboratory, where on separate days the expected mean was returned and achieved by the staining at that laboratory.
And on another occasion, as shown here, the reactivity was much higher.
Now in cooperation with Visiopharm, the host of this series, the tool has been developed for image analysis on their Qualitopix platform.
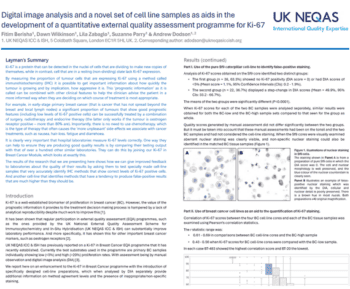
In pilot studies, an example is shown here, showing longitudinal analysis on the Levi Jennings model. And it demonstrates fluctuations of assay sensitivity with significant outliers highlighted in yellow or black.
Those are falling outside one standard deviation of the mean staining expected.
Multiple cell lines are analyzed in parallel on the Qualitopix platform, and may show similar trends in this Levigenics analysis.
But one or more cell lines may serve as indicators of a significant shift in assay sensitivity on a given run.
In this early validation series, a marked upward drift was identified in a laboratory’s assay, prompting a review of the assay parameters. And it was discovered that the laboratory had deviated from the established retrieval conditions with a change to sixteen minutes of retrieval from thirty two minutes. The prior thirty two minute conditions are shown on the left third of this graph where the upward drift is clearly seen.
And the examination occurred where the break is shown and a correction to sixteen minutes of retrieval was performed with achievement of more accurate and consistent results.
However, occasional outliers still do and did occur. As we’ve seen, cell lines can serve as control tools for the overall system, detecting assay failures when they occur, for assay analytical sensitivity, and also serving as references for the interpretation or counting of positive material.
This slide borrowed from Clive Taylor outlines what ideal controls of IHC assays would require.
So far the ideal control fulfilling all of these requirements has yet to be developed. However many of these requirements can be addressed using cell lines. So what are they? They are that the material must be subjected to all the same rigors of sample preparation as the test tissue.
It must be integrated into all steps of the test or assay protocol.
It should contain known amounts of the reference standard protein.
It should be universally available.
And inexhaustible and inexpensive.
This table presents a comparison of the relative merits of three general categories of available control material for IHC assays.
It includes tissue, in this case tonsil, which is frequently used for Ki-67, artificial calibrators like the glass beads with attached peptides, and cell lines as I’ve described in this talk.
As system controls, each type can tell us whether the assay has failed.
As controls for pre analytical phase of processing, only tissues and cell lines address those variables.
The interpretation with respect to such aspects as cellular localization and intensity thresholds is limited also to tissues and cell lines.
The determination of a target antigen concentration is possible with artificial calibrators with great precision. And this is a marked step forward in this field.
However, cell culture materials are now being subject to study by orthogonal methods such as mass spectroscopy and may reproduce a level of precision for estimating target antigen not previously available from tissues.
Cellular context and more broadly issues related to commutability of the reference material are addressed by tissues and cell lines. Material are addressed by tissues and cell lines.
For Ki-67, all of these control types are currently for research use only. With respect to availability, the cell lines and artificial calibrators may be manufactured inexhaustibly and that may become universally available.
Tonsils are typically available, but some types of laboratories have difficulty obtaining appropriate control tissues.
The expense category requires a comparative analysis of the relative costs of labor for retrieval, handling, and routine requalification of in house tissues to the comparative commercial controls.
In fact there may be a compelling economic benefit to commercial sourcing, but that discussion is beyond the scope of this talk.
So there is a clear requirement as reflected in the CAP All Common checklist items for validation to include precision and reproducibility.
Those typically include Intra technician replicates, Intra technician replicates, inter day, inter instrument, and inter reader comparisons.
These control materials as described can provide a very convenient material for making these comparisons with great precision.
And finally for daily QC such controls may serve as batch controls, on slide controls, and are appropriate for use with image analysis.
And with that, I’d like to thank you for spending this time attending this webinar.
And I would encourage anyone with questions or concerns to reach out to me. I look forward to hearing from any of you with continued interest in this subject. Thanks very much.
Okay. So, Regan, thanks a lot for this excellent presentation. And you can switch your camera on now ideally. Hi.
Good morning.
Thanks a lot for this overview. This was really interesting to see all these, clinical aspects of Ki-67 and all the background behind it. So That was really useful.
So everybody is more than welcome to, place their questions into the chat so that we can start with a q and a.
So one thing that I’ve been wondering, maybe I can start while everybody’s typing.
You showed the different thresholds that the guidelines showed of Ki-67 in the in the different years.
Now that we know that there’s so much influence on the stain intensity, do you think there’s a connection to this variance of guidelines that we have and the data of Ki-67 that might be subject to some staining variability?
Yeah. Absolutely. The, guidelines were changed at many times, as you’ve seen, in recognition of the fact that there is so much variability. And part of it has to do with, comparison studies that were performed, where Ki-67 analysis was performed locally, with variants among different sites, as opposed to centrally.
And, so it’s in recognition of those differences that the categories have changed and then ultimately dropped, for example, in breast cancer, as a strict threshold and are still not recommended by NCDCN.
So it will take some time. The FDA approval of the tacroagilent companion diagnostic does suggest that there’s hope in breast cancer for a standardized assay that could be universal.
It’s up to the whole that we call a green one.
So Dirk asked very nice overview. Thank you. Can you give some examples of how laboratories have used these methods to improve staining quality?
Well, yes. As as shown, in one of the pilot studies, in slide that addressed the issue of antigen retrieval time. We did see a direct and immediate response, with respect to continuity, reproducibility of the results.
And, there have been other examples in our pilot studies. We don’t have enough, we don’t have enough time, or, data collected with the experience we’ve had so far, to just point to other specific examples. But, it’s clear that there’s a lot of potential for that. And as we look at, EQA schemes results as they come in, We see the variability in different laboratories and as I mentioned that that can be addressed over time as shown in the example of estrogen receptor. So, as EQA schemes gather data about best practices, they can issue recommendations that will nudge the field towards better results.
Mhmm. Thanks a lot.
And the next question is from Matt. Is it possible to use cell lines as calibrators to create a truly quantitative IHC assay?
Well, I hope you can, hear me with a better sound quality.
Yeah. I have addressed, this question, only cursorily, and that is that, with mass spectrometry. I heard a mistake in the lecture where I said spectroscopy.
We we are pursuing this to a degree, and we do hope that we can, measure the the amount of Ki-67 expressed, within a population, and that would end up being an average expression level within a population, using, native cells.
But one could also imagine using genetic genetically manipulated, cells that in one way or another had, tags that would make it possible for orthogonal tags, attached to the Ki-67 analogous to Steve Bowden’s, glass beads approach such that, an orthogonal method could really help determine, with greater precision, the amount of Ki-67 in the negative cell. That, that remains speculative at this point, but, could be worth keeping an eye on.
Mhmm.
That sounds And then the progress next to genetic yeah.
With respect to genetic engineering, I I also spoke about knockout cells as potential replacements for the fall armyworm cells, the SF9s.
Those would have certain advantages in being mammalian and more specific in terms of their non non specific utility.
However, I have not been able to obtain the cell lines from the two laboratories who, reported that, which is unfortunate.
And instead, I, made several efforts to create them, commercially to create knockout cell lines.
And those efforts failed.
Despite having sequencing data suggesting that the Ki-67 had been knocked out, we still saw expression at a level of at least thirty percent of some antigen that, interacted with with our antibiotics.
So that, was a disappointment. And then finally, it became, it came to our attention that AvChem was marketing a cell line, was a Ki-67 knockout.
We obtained that and subjected it to the same analysis and found that there was detectable antigen at a higher level, higher than zero, but even higher level than what we had obtained. And, so that that for our studies, and and it’s a it’s a real puzzle as to what it would take to actually knock out these cells, such as knock out Ki-67 within these cells, such that there’s no antigen remaining. And I cannot explain why it remains after knockout.
But, the the studies are are very the study shown that I’ve obtained, but I would point out that those two studies did not present IHC data. Rather, they presented Western Blot and, sequencing and RT PCR type data.
So it would be it would be very interesting to see what, what those laboratories would obtain if if using our IHC assets.
Mhmm. Mhmm.
That’s interesting.
Yeah. Seeing do we have any additional questions?
Not seeing anything here, but we also covered a lot already.
Okay.
So if we don’t have any additional questions, I think we can close for today.
And thank you very much for this webinar and for taking the time to answer questions and enlighten us, about Ki-67 and the aligned possibilities.
And then I wish everybody a good evening.
Thank you. It was a pleasure. Okay.
Yeah. Bye bye.
Bye bye.
Ki-67 is a widely used marker of cell proliferation. In his talk, Regan Fulton will give an overview of the biological function of the Ki-67 protein and its utility in different clinical indications. He will demonstrate current problems with the assay’s reproducibility and suggest solutions to improve the standardization of the assay using cell lines.

Regan Fulton, CEO, Array Science, USA
Dr Fulton received his MD and PhD from the University of Minnesota and completed his residency in Anatomic Pathology at Stanford University. Following residency, he completed fellowships in Surgical Pathology and Immunodiagnosis at Stanford University and is board-certified in Anatomic Pathology. He is the founder and CEO of Array Science, LLC, a manufacturer of control and proficiency-testing material. He holds multiple patents for making tissue and cell culture microarrays. He now works full-time at Array Science, while providing pathology support in the development of diagnostics, as well as various phases of clinical trials. Dr Fulton has served as a consultant and paid speaker for several pharmaceutical and biotechnology companies.