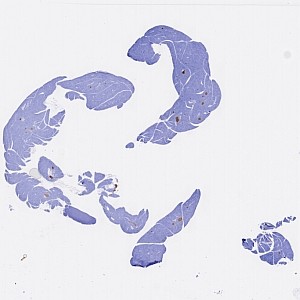
Whole slide image of pancreas tissue.
#10059
The mass of insulin-producing beta cells in the endocrine pancreas is an important determinant of the capacity for insulin secretion. Accordingly, (patho)physiological conditions such as pregnancy or insulin resistance, associated with increased beta-cell mass or as a compensatory mechanism to adapt to increased demand for insulin release. Conversely, beta-cell mass is significantly decreased in both type 1 and type 2 diabetes. Thus, development of time- and cost-effective automated methods to assess both beta-cell mass and turnover (e.g. beta-cell replication) in pancreas sections are valuable for improving our understanding of pancreas morphology in health and disease.
This APP uses insulin-positive area to determine measures of beta-cell area normalized either to total pancreas area examined, or per islet, and calculates beta-cell replication based on the proportion of insulin-positive cells.
Whole slide image of pancreas tissue.
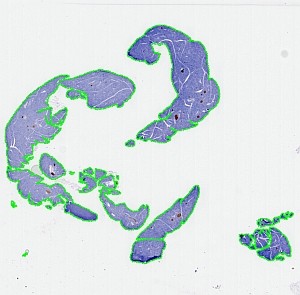
The same image as in FIGURE 1 after automated tissue outlining by the auxiliary ‘01 Detect tissue’.
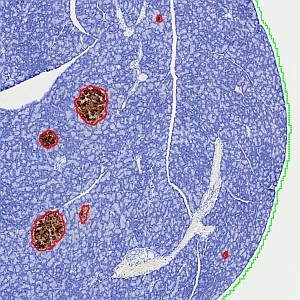
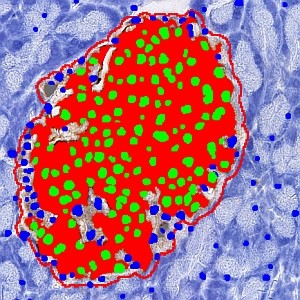
Close-up on part of FIGURE 1 showing the automated identification of islets (red ROI outlining) achieved by the tissue component analysis using the auxiliary APP ‘02 Detect Islets’ with the ROI outlining settings on, and the label layer settings off.
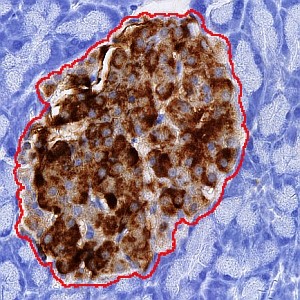
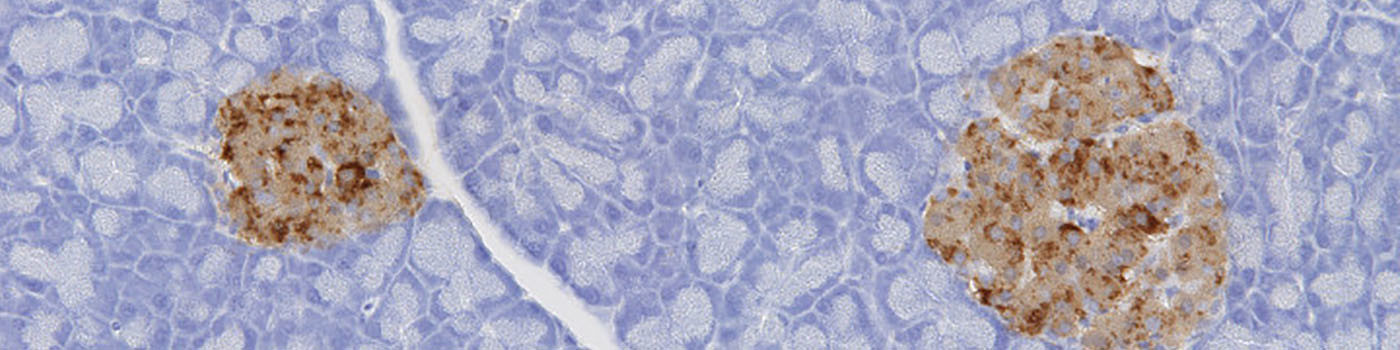
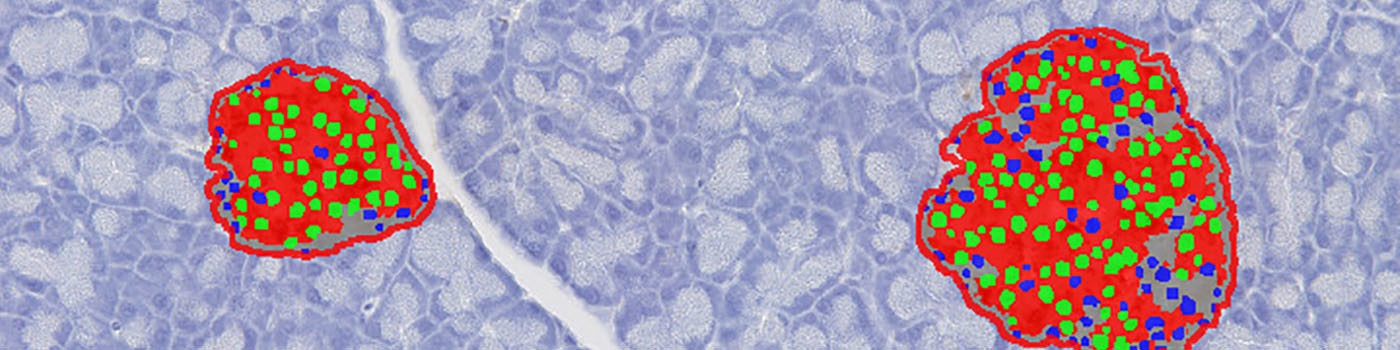
Further close-up on a single islet and its insulin stain and nuclei.
Auxiliary APPs
Auxiliary APPs are used for additional process steps, e.g. finding Region of Interest (ROI).
DETECT TISSUE
This auxiliary APP can be used to automatically detect an ROI outlining the pancreatic tissue. The ROI is generated by distinguishing tissue from background.
No quantitative outputs are created at this step. This could also be performed manually.
DETECT ISLETS
This auxiliary APP will separate the outlined areas into tissue components, identifying fat, lymph nodes, vessels, background, exocrine tissue and islets. Lymph nodes and vessels are excluded; the rest is included in the area of pancreatic tissue.
No quantitative outputs are created at this step. This could also be performed manually.
ISLET CALCULATION
The islet calculation is designed as a follow-up protocol to the quantification and is focused within the previously detected islets. The quantification detects insulin positive area, negative nuclei and positive nuclei. The quantitative endpoints will be outputted per islet.
Quantitative Output variables
The quantitative output variables are created in several steps of the analysis process. The main segmentation of the tissue is used to derive information on the pancreatic area and islets. Per islet calculations are derived from the final calculation step.
Workflow
Step 1: Load auxiliary APP for tissue detection ’01 Detect tissue’ and run on the image to process. This outlines the tissue with a Region Of Interest (ROI) and saves time in the subsequent analysis steps.
Step 2: Load auxiliary APP ’02 Detect Islets’ and run on the image to segment the tissue into different components: Pancreas exocrine, vessel, fat, lymph and islets. The islets are dilated (enlarged) to ensure nothing is missed and turned into individual ROIs.
Step 3: Load APP quantification protocol ’03 Analyze’ and run on the images to process. The third image processing step segments the islets into beta cells, non-beta cells and empty space.
Step 4: Load APP calculation protocol ’04 Islet Calculation’ and run on the images to perform per islet calculations.
Methods
The first image processing step outlines the tissue with a Region Of Interest (ROI). This is to save time in the subsequent analysis steps. The analysis is carried out at 1x magnification and finds larger pieces of tissue. Dust and small artifacts are ignored. There are no quantitative output variables from this step (see FIGURE 1 and 2).
The second image processing step segments the tissue into different components and takes the varying staining intensity along the edges of the tissue into account. The tissue is segmented into pancreas exocrine, vessel, fat, lymph and islets. The islets are outlined with a separate ROI, to allow for subsequent per islet calculation. This is followed by the quantification of the entire tissue section, segmenting the islets into beta cells, non-beta cells, nuclei within islets, and nuclei outside islets.
For a detailed description on the workflow (see Additional information)
Staining Protocol
Beta Cell immunohistochemistry and Beta cell/Ki67 double label immunohistochemistry conditions were optimized and validated at the Histology and Imaging Core, University of Washington, Seattle Washington.
The sections were immunostained on a Leica Bond Max automated IHC staining platform using optimized staining protocols with DAB and Vina Green (BioCare Medical) as chromagens according to protocols developed at the Histology and Imaging Core (www.uwhistologyandimaging.org).
Additional information
This APP was developed for, and validated in cooperation with the Histology and Imaging Core/Comparative Pathology Program, Department of Comparative Medicine, University of Washington, Seattle Washington (www.uwhistologyandimaging.org) and the Diabetes Research Center, University of Washington, Seattle Washington.
Keywords
Insulin, diabetes, beta-cell mass, beta-cell replication
References
USERS
This APP was developed for, and validated in cooperation with:
The Histology and Imaging Core/Comparative Pathology Program, Department of Comparative Medicine, University of Washington, Seattle Washington (www.uwhistologyandimaging.org).
Charles W. Frevert DVM, ScD
Associate Professor
Comparative Pathology Program
Department of Comparative Medicine
Brian Johnson
Program Manager/Research Scientist
Histology and Imaging Core/Comparative Pathology Program
Cara Appel
Imaging Specialist/Research Scientist
Histology and Imaging Core/Comparative Pathology Program
The Diabetes Research Center, University of Washington, Seattle Washington.
Rebecca L Hull, PhD
Research Associate Professor
Co-Director, Diabetes and Metabolism Enrichment Program
Associate Director, UW Diabetes Research Center Cellular and Molecular Imaging Core
LITERATURE
There are currently no references.