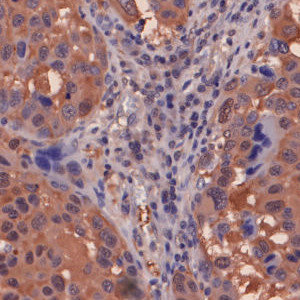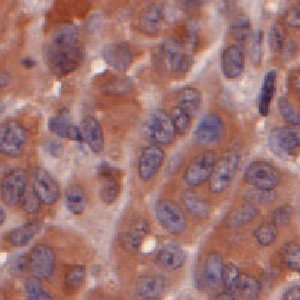
Nuclei surrounded by MIF intermediate and high staining.
#10131
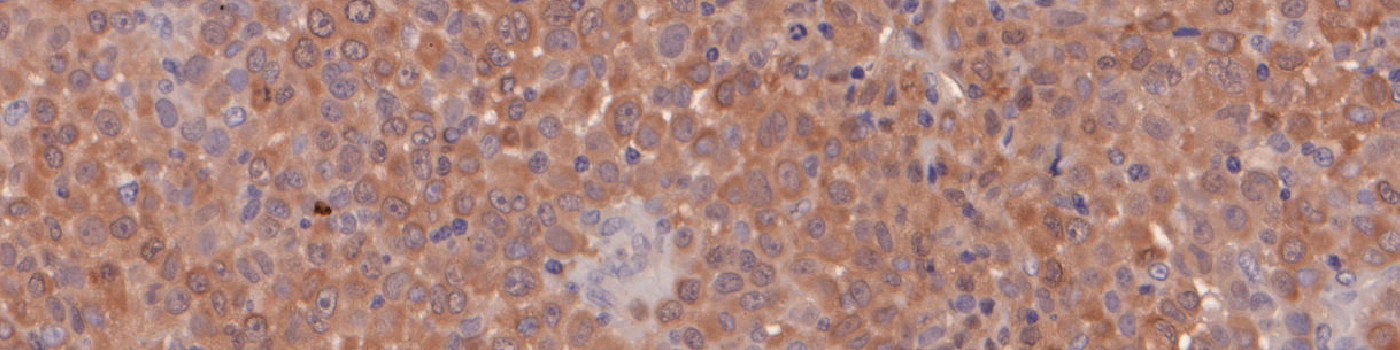
Macrophage migration Inhibitory Factor (MIF) is a dominant cytokine that acts through CD74 to promote cell proliferation, migration and survival pathways in both immune and epithelial cell types. Its binding to CD74 initiates survival pathways and cell proliferation. It is known as a pleiotropic proinflammatory protein for which the effects include the promotion of cytokine expression and inhibition of apoptosis.
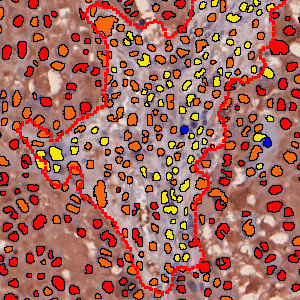
The “10131 – MIF, Melanoma, TME” APP detects nuclei and classifies them as either negative, 1+, 2+ or 3+ based on the MIF staining expression present in each nucleus’ vicinity.
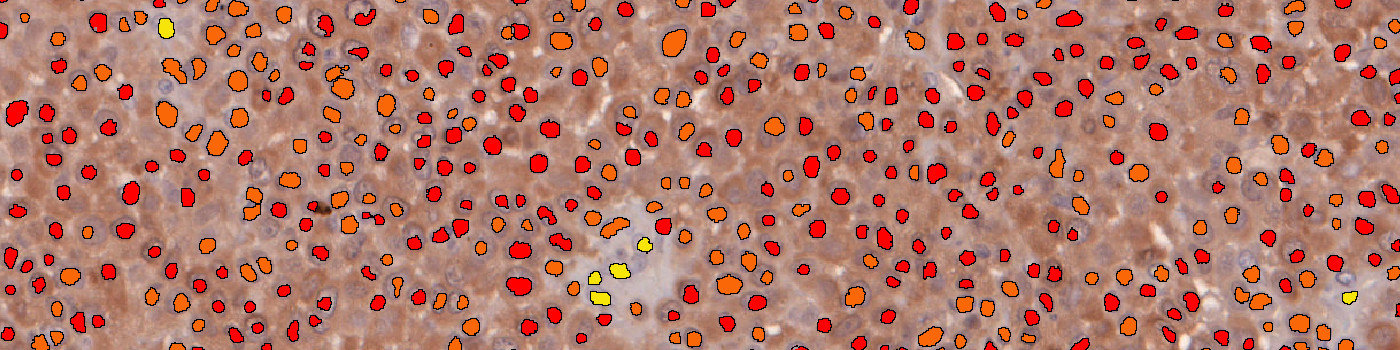
Nuclei surrounded by MIF intermediate and high staining.
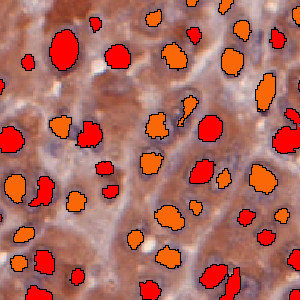
Nuclei classified as 2+ (orange) or 3+ (red) based on the MIF staining present in each nucleus’ vicinity.
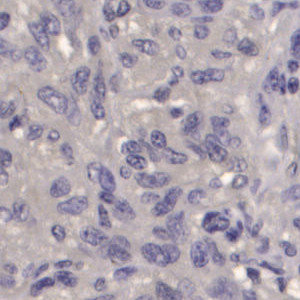
Nuclei surrounded by MIF negative and low staining.
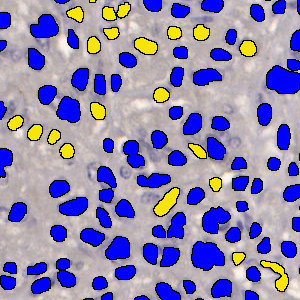
Nuclei classified as negative (blue) or 1+ (yellow) based on the MIF staining present in each nucleus’ vicinity.
Auxiliary APPs
APP: “01 Detect TumorStroma”
The auxiliary APP: “01 Detect TumorStroma” is used for automatic tumor and stromal tissue detection. The analysis APP will then provide results for tumor and stromal tissue separately.
Quantitative Output variables
The output variables obtained from this protocol include:
Workflow
Step 1: Load and run the APP “01 Detect TumorStroma” for tumor and stromal tissue identification. Manually correct result if needed.
Step 2: Load and run the APP “02 MIF Analysis” for the quantification of cells.
Methods
To identify the nuclei, the APP performs a two-stage polynomial blob filtering on a blue-enhanced feature image and delimits them using local linear filtering. Each pixel with DAB staining is classified as low, mid and high based on the intensity and grouped together locally. Each nucleus is then classified based on its surroundings in the order of 3+, 2+, 1+ and negative to emphasize the strongest staining present in each nucleus’ vicinity.
Staining Protocol
There is no staining protocol available.
Keywords
MIF, macrophage inhibitory factor, melanoma, skin, CD74, cancer, oncology, IHC, tumor micro environment
References
LITERATURE
There are currently no references.