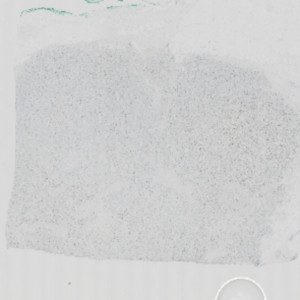
Macroscopic view of Ki-67 stained slide


#20114
Standardizing hot spot analysis
Cancer can rapidly mutate and adapt, potentially producing heterogeneous tumors making it important to evaluate a specimen in a hot spot, where the tumor cells have increased activity.
Hot spot analysis for Ki-67 scoring has often been used for proliferation index assessment in breast cancer [1]. However, manual hot spot scoring is subjective and prone to both intra- and inter-observer variability [2]. If not accounted for, non-invasive cancer structures can also affect both hot spot location and proliferation index.
The Hot Spot APP provides an automatic and objective hot spot scoring that has been shown to outperform manual biomarker assessment [3]. The APP presents pathologists with a heatmap for easy visualization of tumor heterogeneity.
Configurable for your analysis
The Hot Spot APP is configurable for both shape and size to facilitate analysis of different types of tissue and stain. To the right, four hot spot examples are shown with corresponding proliferation indices. The Hot Spot APP facilitates both a predefined size and shape or an adaptable hot spot with a predefined number of nuclei.
Complete Ki-67 analysis workflow
The Hot Spot APP works in a fully automatic workflow

The workflow example above considers a Ki-67 IHC analysis. Tumor is automatically identified and separated into invasive and non-invasive regions based on a physical double stain of p63+CK7/19 (Step 1+2). Ki-67 is quantified within the invasive tumor components (Step 3).
The Hot Spot APP creates a heatmap based on the density of the positive nuclei (Step 4), identifies a hot spot, and outputs the Ki-67 proliferation index (%) for the hot spot (Step 5).
In EU/UK: CE IVD – for use in diagnostic procedures
Benefits of Hot Spot APP
Clinical studies
The clinical performance of the APP was determined by comparing hot spots placed by a pathologist to hotspots placed by the Hot Spot APP. A very good agreement was obtained for all three sites, with an accuracy of 97.1%, 97.5%, and 94.7%, respectively.
| Site | Samples (n) | Samples in agreement (n) | Accuracy | Lower 95% CI |
|---|---|---|---|---|
| Pathologist Diagnostics Jarutat | 34 | 33 | 97.1% | 83.8% |
| Karolinska Institutet | 40 | 39 | 97.5% | 86.0% |
| Nap Pathology Consultance | 38 | 36 | 94.7% | 81.8% |
| Total | 120 | 108 | 96.4% | 90.9% |
Slide scanners: Hamamatsu NanoZoomer HT 2.0, Hamamatsu S360
Stain vendors: Ki67: Dako/Roche Ventana, p63: Zeta/Roche Ventana, CK7:Dako, CK19: Cell Marque/Roche Ventana, Cytokeratin: Dako
CE-marked for in vitro diagnostics
The clinical performance of the APP was validated in collaboration with:
References
1. Assessment of Ki67 in Breast Cancer: Updated Recommendations From the International Ki67 in Breast Cancer Working Group, JNCI: Journal of the National Cancer Institute, Volume 113, Issue 7, July 2021, Pages 808–819
Torsten O Nielsen, MD, PhD, FRCPC, Samuel C. Y Leung, MSc, David L Rimm, MD, PhD, Andrew Dodson, MPhil, FIBMS, CSci, Balazs Acs, MD, PhD, Sunil Badve, MBBS, MD, FRCPath, Carsten Denkert, MD, Matthew J Ellis, MB, BChir, BSc, PhD, FRCP, Susan Fineberg, MD, Margaret Flowers, PhD, Hans H Kreipe, MD, Anne-Vibeke Laenkholm, MD, Hongchao Pan, PhD, Frédérique M Penault-Llorca, MD, PhD, Mei-Yin Polley, PhD, Roberto Salgado, MD, PhD, Ian E Smith, MD, FRCP, FRCPE, Tomoharu Sugie, MD, PhD, John M. S Bartlett, BSc, PhD, FRCPath, Lisa M McShane, PhD, Mitch Dowsett, BSc, PhD, Daniel F Hayes, MD
3. Jang, M. H., Kim, H. J., Chung, Y. R., Lee, Y., & Park, S. Y. (2017). A comparison of Ki-67 counting methods in luminal breast cancer: The average method vs. the hot spot method. PloS one, 12(2), e0172031.
4. Stålhammar, G., Martinez, N. F., Lippert, M., Tobin, N. P., Mølholm, I., Kis, L., … & Grunkin, M. (2016). Digital image analysis outperforms manual biomarker assessment in breast cancer. Modern Pathology, 29(4), 318