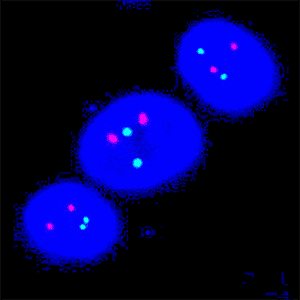
Nuclei with amplified gene signals
#10035
The Human Epidermal Growth Factor Receptor 2 (HER2) is a central biomarker in invasive breast cancer, and the HER2 status has both important prognostic implications, and is predictive for the patient’s response to HER2-targeted treatment. According to the guidelines of the American Society of Clinical Oncology/College of American Pathologists (ASCO/CAP), the HER2 status must be determined by genetic and/or protein expression analysis of breast tissue sections using immunohistochemistry (IHC) and/or in situ hybridization (ISH), respectively, see [1].
To determine the HER2/CEN-17 ratio, the total number of HER2 signals (Red) and the number of CEN-17 (Green) signals in the same 20 nuclei are identified. The total number of HER2 signals is then divided by the number of CEN-17 signals. Ratios above 2 are classified as amplified whereas ratios below 2 are classified un-amplified. Caution should be taken when results are near the cut-off (1.8 – 2.2).
The operator only needs to define an overall region of interest.
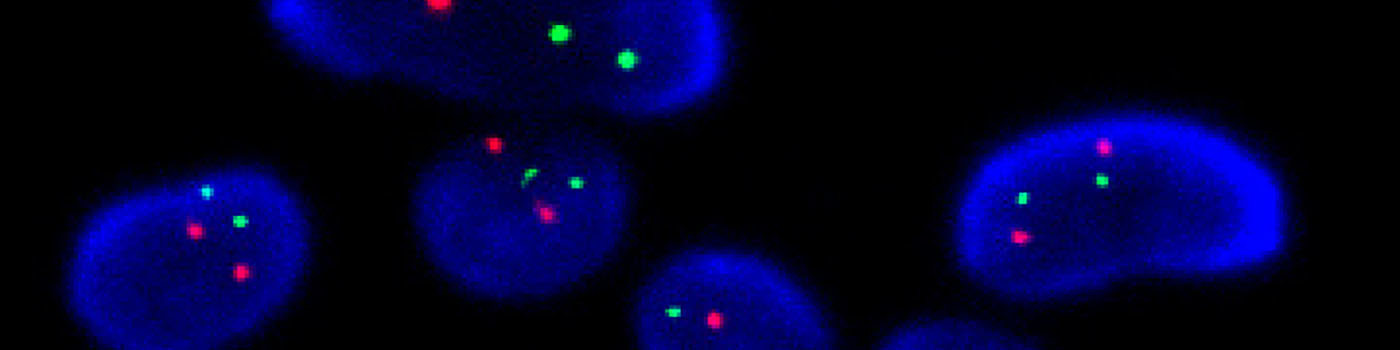
Nuclei with amplified gene signals
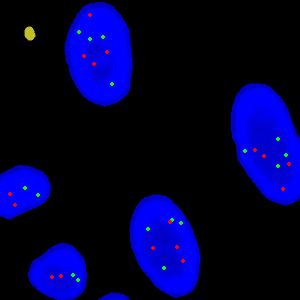
Detected nuclei and gene signals, invalid nuclei (DAPI signal) are colored in yellow
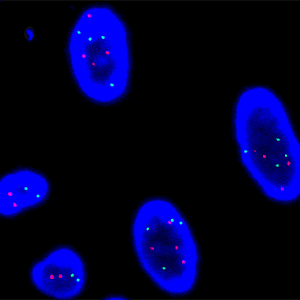
Nuclei with non-amplified gene signals
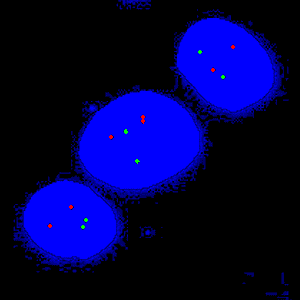
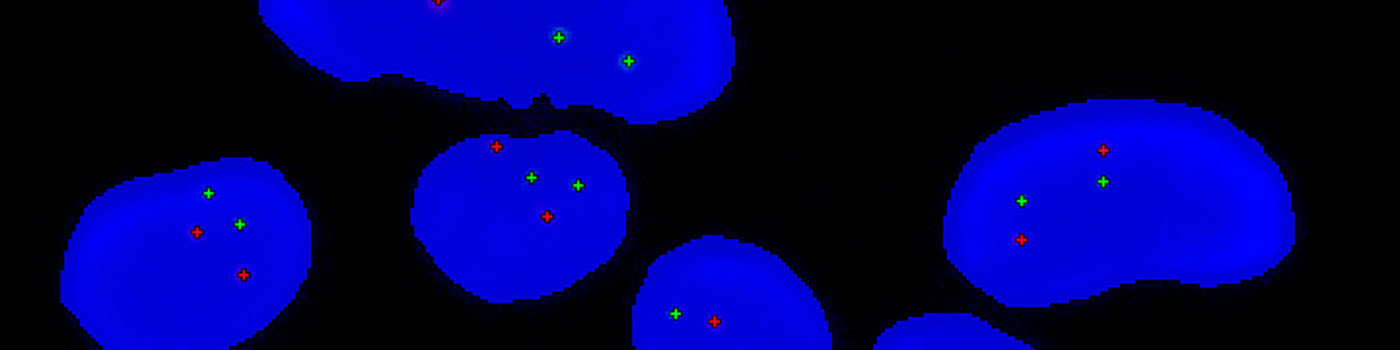
Detected nuclei and gene signals
Quantitative Output variables
Four outputs are obtained from this protocol:
References
LITERATURE
1. Wolff, A.C. et. al., American Society of Clinical Oncology/College of American Pathologists guideline recommendations for Human Epidermal GrowthFactor Receptor 2 Testing in Breast Cancer, J. Clin Oncol 2007, 25 (1), 118-45, DOI