Transcript
Think we are live. We’re just gonna wait a little bit to get started. Welcome, everyone.
Alright. I think we can start now. Good morning, Sarah.
Good morning.
Welcome to this webinar and welcome everyone who is here with us for another research rebellion tour webinar series.
Today with us, we have Sarah Klein, who is an Associate Director at Cell Signaling Technologies, and she’s going to be presenting a really nice presentation today about spatial analysis of the immunosuppressive tumor microenvironment with SignalStar multiplex immunohistochemistry.
This presentation is going to take around half an hour and after that everyone is welcome to ask questions and using the chat for that.
This webinar will be recorded. So if you want to rewatch later or you want to share with your colleagues, we are going to share the link afterwards.
We’re going to start today with some polls just to give people some time to to join and to engage a little bit.
So first one is very simple question.
Do you have a multiplex instrument in house? I’ll give you some time to answer.
Okay. It seems like the majority of people here have. That’s good.
I’m gonna move on to the next question now.
There you go. So are you using or planning to use multiplex if and yeah.
Okay. I’m gonna launch the next question.
What is your biggest challenge in spatial biology today?
All right. Now, last question before we start the presentation.
How do you currently analyze spatial proteomics data?
Okay. I think we can now get started.
I’ll see you at the end during the q and a.
Hi everyone. I’m excited to be here today to discuss how novel spatial proteomics tools from Cell Signaling Technology can be used to analyze immunosuppressive tumor microenvironment and novel immune phenotypes linked to disease outcomes.
Scientists have over and over demonstrated the importance of analyzing the spatial context of multiple biomarkers that define the tissue architecture, the cell populations present, the actions of these cells and how they interact in the tumor microenvironment. They speak of how spatial analysis is critical for understanding disease or patient heterogeneity and more recently have found success in the discovery of novel protein signatures to stratify clinical patients for targeted therapy and personalized medicine.
The importance of reliable and reproducible tools in this space is growing with every step scientists make closer to the clinic.
I’d like to kick off my talk today therefore discussing the importance of antibody and assay selection in your spatial proteomics workflow because our biological findings from spatial technologies are only as good as the technologies themselves. We know that there are a lot of spatial technologies out there from Ecoya PhenoCycler, the 10x, Sidium, and Atara, the Luton four or Bio Technospatial Comet.
There’s a lot of ways that this can be done, but all of these for protein detection, all of these, most of these workflows require an antibody at the beginning of this assay as the foundation of this assay.
And importantly, antibody based assays are only as good as the specificity of the antibodies used.
Unreliable antibodies increase the risk of experimental failure, inaccurate or uninterpretable results and squander limited tissue samples. It is estimated that approximately fifty percent of commercial antibodies fail to meet even basic standards of characterization.
This is a problem that is thought to result in the financial losses of like zero point four to one point eight billion per year in the United States alone.
There’s estimates of one point six million commercially available antibody targeting ninety six percent of human proteins.
And this is a really big problem.
But there are ways to mitigate these risks. Confirming your antibody and the foundation of your spatial proteomics workflows can be trusted. Cell Signaling technology focuses on validating our antibodies for spatial biology using multiple parameters, not just one. Most importantly, we focus on multiple species, tissue preparation methods, and assay formats. No single test is sufficient and not all antibodies will work on both human and mouse tissues or both in FFPE or fixed frozen tissues. This validation is critical to the success of multiplex protein imaging experiments.
And many spatial workflows require antibodies to be conjugated to specific moieties for detection, like oligonucleotides or fluorophores.
Validation of your antibody is important both before and after conjugation.
Here we see HER2 looking great in human breast cancer carcinoma, but when we test in additional tissues, we can see nonspecific nuclear signal appear after conjugation. This is an example of an antibody that is impacted by the conjugation process itself and therefore would fail our validation.
CST offers a variety of off the shelf unconjugated and conjugated antibodies that are fully validated for use in multiplex imaging experiments for human or mouse, FFPE or frozen tissues, many in a format that is compatible with common auto staining and imaging instrumentation.
In addition, CST offers custom conjugation, which enables target and antibody flexibility to study more diverse biomarkers or a very specific biomarker of your interest, but it would require scientists to perform their own optimization and validation after conjugation, as I just showed.
So you can see here we have OTS primary antibodies that can be combined with fluorescent secondary antibodies for indirect immunofluorescence. We have primary antibodies that are directly conjugated to fluorophores that can be used for imaging, as well as I’ll show you more details later about our SignalStar multiplex IHC technology. First, I’ll go through the primary antibody fluorophore conjugates. These are used for direct immunofluorescence. Basically it is an antibody that is directly conjugated to fluorophores and you just apply that to the tissue, wash and image your slide.
It is the easiest of the protocols but usually can only be used for strong phenotypic markers. Because there’s only a handful of fluorophores that combine to the antibody, it really doesn’t enable signal amplification and sometimes it’s not able to overcome the background signal that tissues especially in FFPE often have. So you can see here this can be performed in multiplex really depending on the capability of your microscope to be able to separate the different fluorophores.
For secondary antibody fluorophore conjugates, so we have a selection of over two thousand five hundred antibodies that are validated primary antibodies that are validated for FFPE. They can now be combined with secondary antibody fluorophore conjugates. As you can see, because you have multiple secondary antibodies that combines the primary antibody and many fluorophores on each of those secondary antibodies, you can get more increased signal to noise above a directly conjugated primary antibody. So this will enable you to get a little bit more of that signal from the previous option. However, this technology is limited by the host species of your primary antibody. Right now, often in imaging, scientists are only able to utilize rabbit monoclonal antibodies or mouse monoclonal antibodies or rat monoclonal antibodies in order to come in with secondaries and detect those for indirect immunofluorescence.
However, CST now has available additional species enabling increased flexibility, assay design flexibility for indirect immunofluorescence experiments. So our same rabbit monoclonal antibodies are engineered recombinantly to have basically replaced the rabbit Fc portion with either a feline, a horse, a mouse, and coming soon a chicken backbone. That enables you to have the same very highly specific Fab region of the rabbit monoclonal antibody that binds to its epitope just the same as it’s done in the rabbit antibody, but now have more flexibility in the Fc region to detect it with a different secondary.
This will enable you to get up to, this example, four plex instead of just a rabbit and mouse. You can now do rabbit, mouse, horse, and feline within your indirect immunofluorescence and again chicken will be coming in a short time. And lastly, I wanted to go through our SignalStar multiplex IHC.
SignalStar is a method for approximately three to eight plex imaging and really the difference between this and our previous methodologies is the signal amplification. SignalStar enables thousand fold amplification of the fluorescent signal due to its nature of complementary oligo formations. This enables target flexibility with limited assay optimization. All of the antibodies that are available for SignalStar have already been validated in APLX and are available in different formulations and different panel designs.
Again, we have that maximum signal amplification for accurate target detection for targets that are expressed in low abundance and may not be able to be detected accurately by direct immunofluorescence or indirect immunofluorescence. There’s a panel builder that enables seamless panel design that you can find on our website. The antibodies are all added at once in the first step of the protocol, Therefore, there is no antibody cycling and there is no concern for umbrella effects that can be often seen with TSA type technologies.
In addition, there are automated and benchtop protocols for the SignalStar assay.
How does SignalStar work? So tissues are prepared as they usually are and all of the SignalStar antibodies are added at once. All eight antibodies can be added at once. Each of these antibodies have a unique oligo barcode that is bound to them so they can individually be detected by complementary oligos to those unique barcodes. So the antibodies are added and fixed to the tissue and then the complementary oligos are added hybridized to those unique tags of the first four antibodies. We then come in with fluorescent oligos to amplify the fluorescent signal in the four eighty eight, the five ninety four, six forty seven, and seven fifty channels.
The oligos are ligated together for stability so that you don’t have to rush to the microscope in order to image.
Once imaging is complete, there is a double stranded DNA enzyme that is used to cleave off all of the double stranded oligos. You can see here all the fluorescent signal is removed between imaging rounds and then you can come in with again complementary oligos that are specific to the next four antibodies in the panel that will enable you to amplify in the same fluorescent channels the second four antibodies. Once you have the two images, both the first image of the first four and the second image of the second four antibodies, you can then utilize solutions such as Visiopharm’s tissue align to be able to align those images, and I’ll show data from that in the next few slides.
So, SignalStar, again, these antibodies have been rigorous ly validated in the same level that we perform all of our validation at CST. So all of the antibodies have been tested in all four channels. They’ve been validated in eight plex. They’ve been validated in multiple multiplex panels, so we enable that flexibility of swapping antibodies in and out of different parts of the panel and enable the same reproducibility regardless of antibody swapping and panel design. And so you can see here we’re looking at an eight plex in triplicate compared to the single plex staining and compared to the chromogenic gold standard DAB that we see really, really high consistency across these different imaging rounds and even days because these images were taken on different days. The most important things about SignalStar is its ability to amplify the signal for detection of low biomarker expression.
So you can see, for example here, we’re looking at CD8 as a marker which we know is a very abundant marker and when you compare across SignalStar multiplex IHC, tyramide signal amplification or TSA, indirect immunofluorescence that I showed you earlier with a primary and secondary antibody or direct immunofluorescence with just a conjugated primary antibody. You can see in the top graph on the left that the signal decreases However, on the bottom when you look at the number of cells present within the tissue, you’re seeing about the same percentage of cells present which indicates that something like CD8, which is a very strong biomarker, does not require amplification in order to detect accurate levels of this epitope.
However, when you start looking at targets that are more variably expressed in tissues such as PD-1 that responds to the immune response and an active immune response, you’re going to see that some cells are brighter, some cells are less bright, and PD-1 can be very low expressed on some of the cells within your tissue. And when you compare our SignalStar amplification versus indirect and direct immunofluorescence, again on top you can see the difference in fluorescence intensity, but on the bottom this time you can also see a difference between the percent positive cells. This indicates that for some targets it is very important for you to amplify the signal using TSA or SignalStar multiplex IHC in order to detect the accurate percent positive cells within your tissue.
And you can see an example of this within a single tissue where you can zoomed in really close and you can see these high expressing PD-1 cells, these medium expressing cells, and then these very low expressing cells. We’ve confirmed that membranous staining and that it colocalizes with targets such as CD3 and CD8 indicating that this is in fact PD-1 expression that is not being detected by technologies like indirect and direct immunofluorescence.
SignalStar is also a nondestructive technology, so here we can show that scientists can perform H and E after SignalStar. We’ve also performed experiments like direct immunofluorescence after SignalStar. We don’t recommend performing indirect immunofluorescence because the antibodies are fixed to the tissue and therefore coming in with a secondary antibody would also detect SignalStar antibodies. Therefore, combining this with different assays, especially things like transcriptomics, might be a possibility and something that we are eager to showcase with other collaborators. Please reach out.
In addition for SignalStar, we have our primary antibodies that are conjugated to oligos. We’ve also enabled secondary antibodies that are conjugated to the oligos. This enables scientists if they have antibodies that they’ve made in house or antibodies that are from other vendors that very specifically they need to use for their target that they can’t find within the catalog of CST, they can now come in with an anti rabbit or anti mouse secondary antibody to detect those two primaries. This happens before you come in with the directly conjugated SignalStar oligo antibodies, and so it integrates seamlessly into the protocol and can be performed within the two imaging rounds that are available.
So in summary, again, SignalStar is a three to eight plex translational tool. However, we’ve collaborated with many scientists now to showcase that although the three to eight plex is a fully validated solution that can be used following protocol that is provided for SignalStar. If they combine multiple kits and get a little experimental with it, they’re able to get up to sixteen even twenty four plex. We have posters available on our website demonstrating this with our collaborators.
Again, SignalStar amplification enables accurate detection of variably expressed targets such as PD-1, PD-L1, and other examples that we have throughout literature. This technology is compatible with any imaging instrument and analysis software, including the Visiopharm software for tissue align and segmentation and so forth, into analysis, which I’ll show you in the next examples where we did just that. SignalStar is validated for reproducibility on FFP tissues and tissue microarrays. I’ll move on to the few examples where we utilize this in some biologically relevant studies that we’ve performed with our collaborators.
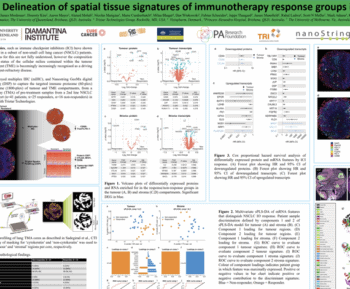
One vignette that we’ve worked on with our collaborators externally is trying to understand the myeloid compartment of the tumor microenvironment. The QR code can be used to scan if you’d like to go take a look at the poster and the data in more detail.
For this study, we were looking at the myeloid cells and the M1 and M2 like macrophages. I very specifically say M1 and M2 like as we know from extensive literature in the field that there isn’t it isn’t a black and white. It isn’t a it is much very much a spectrum of expression of different biomolecules that enable a function that is more pro inflammatory in the M1 like and more anti inflammatory in the M2 like and depending on the balance of the expression of these different cytokines and receptors, these macrophages can tip from one to the other and have more of the function of either pro inflammatory or anti inflammatory. And so limited as we are by the eight plex that we performed, we chose markers that were best indicative of defining a cell that is more M1 like and cells that are more N2 like. And we also included some functional markers such as Serb alpha, some activation markers, and some immunosuppressive markers such as Serb alpha, arginase, and PD-L1.
We validated this panel in APLX across multiple tissues and then for this study I’ll focus in on human squamous cell lung carcinoma that we dove deep into the analysis and to visualize these subsets in proximity to each other.
So utilizing and partnering with Visiopharm and utilizing their software, we were able to view both the day one and day two images and use their tissue align software to accurately align the two different images into a single APLX image. You can see that here. We’ve zoomed in and you can see using the DAPI signal how the nuclear alignment is very, very high for these two aligned images.
We then also went from there and performed segmentation and phenotyping of the cells based on the markers that were provided in the panel. Once we phenotyped, were able to define cell types as positive for these different phenotypes and there were hundreds of different phenotypes, but we were able to look individually at these markers and where they were expressed relative to the PD-L1 positive tumor. So you can see here in red the PD-L1 positive tumor and we were able to look at the invasive margins approximately thirty micrometers outside of that PD L1 red signal and then from thirty to sixty micrometers outside of that.
So further and further away from the tumor periphery and then at last in the blue outline is the stroma, the transparent blue outline. And so we were able to differentiate these different regions adjacent to the tumor and look at the presence of these different markers, these myeloid markers at the invasive margins and you can see that all of the myeloid markers are very highly expressed at the invasive margin, close from zero to thirty micrometers away from the PD-L1 tumor but not within the PD-L1 positive tumor and much lower externally in the stroma and this kind of trended for all of these markers.
Importantly, we were able to detect arginase positive cells. We didn’t see a trend in terms of its localization, but even being able to detect it is something a little unique to amplification technologies like SignalStar, whereas it’s because this target isn’t abundantly expressed in tissue, it sometimes can be very hard to detect it using other methodologies.
So then we unbiasedly looked at the different M1 and M2 phenotypes, a few different ways of looking at it. On the left hand side, the CD68, CD163, and then CD163, CD206. CD163 and CD206 are those two like phenotypes that are markers that are indicative of immunosuppressive myeloid cell and on the far right here you can see CD11c and HLA Doctor together with CD86 with and without CD86 showcasing the different cell types that are leaning towards that M1 phenotype, the pro inflammatory type. So you can see that there were more of the pro inflammatory markers closer to the invasive margins from zero to thirty micrometers and then compared to the CD163, CD206 anti inflammatory M2 type markers and that most of these were not inside the tumor as we mentioned and lower within the stroma.
So we’re seeing a little bit of a difference between those two subtypes and the presence of those at the invasive margin. And this can be quantified using the Visiopharm software where you can see that M2 like macrophages tend to be clustering adjacent to the tumor but not again right at that invasive margin. You can see those highlighted in that pink and yellow and then if you go over to the boxes that I’ve outlined on top, we’re looking at neighbor counts. This is showing kind of the number of CD163, CD206 positive cells that are neighbors to or very close to CD163 arginase positive cells and two markers of that M2 like phenotype.
And so there’s a lot of these cells that are aggregating together and if you look in the next graph, the distance between them is very low and so you can see that these cell types are very much aggregating together and clustering adjacent to the tumor. Importantly, arginase one positive cells mainly localized to the inside of these myeloid clusters versus the outside of these myeloid clusters.
If you look on the other side at the M1 like macrophages now highlighted in pink and yellow, can see that these cells were clustering at the invasive margin not necessarily with each other.
So you can see that there’s a lower number of the M1 like markers, the CD11c, HLA Doctor positive cells, they’re not clustering with the CD163 and CD206 positive cells and they’re also much further in distance as well. So instead these M1 biomarker expressing macrophages are clustering within that invasive margin you can see around that red tumor.
So in summary of this little vignette, SignalStar Multiflex IHC amplify the signal of all eight targets of the cell type and phenotype markers including arginase one which again can be expressed in very low abundance within tissue.
We used the deep learning based image alignment tissue alignment which enabled precise overlay of the sequential imaging rounds and ensured consistent localization of target signals. We used Phenoplex to enable the identification of those distinct cell populations by Visiopharm to enable the identification of distinct cell populations, allowing for accurate quantification of biomarker co expression and evaluation of cell population distributions across the tissue, us to see that the N1 polarized cells didn’t necessarily aggregate with the M2 polarized cells. The M1 polarized cells often aggregated more often at the tumor invasive margin.
And lastly, I have another vignette, this time shifting over to another immunosuppressive cell type that many scientists have been working on for decades around immunosuppressive T cell subsets, looking at T cell exhaustion and the function of T cells that are unable to elicit an immune response in response to diffuse large B cell lymphoma. So again, this was work that was done in collaboration and I’ll go a little bit into the biology, which I’m sure many people know better than me, but the exhausted T cells result in reduced anti tumor immune responses. And again, an exhausted T cell is not a distinct phenotype.
It a continuum of T cell functional states that exist and this is becoming more and more understood, especially now that there are more complex spatial proteomics and transcriptomic technologies out there to help us understand these functional states from stem like to affect your cell to exhausted to terminally exhausted versus exhausted that can be reinvigorated to respond to a threat. We know that terminal exhaustion can happen after chronic androgen exposure. Often, you know, a lot of the work that has been done with exhausted T cells were done with infectious disease, but have also been seen again with chronic androgen exposure by tumors leading to terminal exhaustion and therefore the T cells cannot respond tumor and remove the tumor.
So preventing T cell exhaustion conditionally or genetically is really important, as you can imagine, for the success of CAR T cell therapies as we wouldn’t want to be administering CAR T cell therapies that are then of induced exhaustion and are no longer able to perform their antitumor immune responses.
And so in collaboration with PhysioFirm as well as with Giorgio Imranani at Weill Cornell, we were able to perform a study in diffuse large B cell lymphoma to look at and evaluate T cell exhaustion in the context of these tissues but also in response to therapy because fortunately Georgia was able to provide a TMA of thirty individual TMA cores that we were able to stain using the SignalStar technology and even more fortunately was able to provide nineteen of which that had clinical data associated with it that showcased that there were eight complete responders and three progressive disease following just standard of care treatment for diffuse large B cell lymphoma.
And the idea here was trying to understand the differences similarities between these responders and non responders to better understand what is happening to the T cell compartments between these cohorts. For this panel, again, as I mentioned earlier, SignalStar can be expanded beyond its traditional fully validated eight plex into a larger panel and so for this one we went forward with a twelve plex that was performed in three rounds of imaging. So in order to do this, all of the antibodies are again added at once, all twelve antibodies are added in the first step, fixed to the tissue and then in the first imaging round you would apply specific complementary oligos to the first four antibodies you see at the top of this table.
Remove those after imaging and apply the second round of oligos, remove those, apply the third round of oligos. There’s no concern that by the third round that you are worried about epitope degradation or tissue moving or anything like that because the antibodies are already bound at the beginning of the assay. And so we were able to easily detect a target like Granzyme B that might be more variably expressed. We’re able to detect that in the third round, unlike other technologies maybe wouldn’t be able to provide.
And so we fully validated this again across the rounds, across multiple tissues, with controls, with our chromogenic gold standard to confirm that what we were seeing was accurate and expected. And so you can see we’re able to visually see all three rounds of imaging and all twelve targets simultaneously within tissue.
And we were able to utilize the Visiopharm software to again align all three images, perform segmentation, perform phenotyping, and identify nine hundred unique phenotypes within all of these thirty tissue microarrays that were available to us.
Utilizing some of the analysis tools that Visiopharm enables, we’re able to look at basically which phenotypes were most present in complete responders versus progressive disease. So this isn’t telling us much. We aren’t able to see many differences between these using this graph here. However, when we dive into those individual biomarkers and look again just first individually before we start looking at all of the phenotypes that are available to us, we can already see some trends between the complete responders and the progressive disease.
We found that there were significantly more CD3 T cells in the complete responders versus progressive disease and that these were not necessarily specifically CD8 T cells. We also found some non significant, but again, this is a very small cohort, so I think the power of the cohort would be greater if we had more samples. So we did see differences in PD-L1 as well as in Granzyme B expression, And these differences would need to be confirmed across a larger cohort of tissues and is indeed being confirmed across a larger cohort of tissues.
Something unique that was really exciting from Visiopharm is that we were able to look at complete responders in progressive disease in the form of a TISN plot where it’s unbiased evaluation of all of the phenotypes, nine hundred phenotypes that are available and see them kind of in distribution to each other and between the complete responders and progressive disease. And you can already see just visually that there is definitely different populations that are present in either complete responders and progressive disease.
And when you zoom in, you can start picking out these different populations and see that again, I very much zoom in, can see that there are very few cells that are present in progressive disease versus the complete response has a large cohort of these cells.
We then did a volcano plot to be able to better understand which of these populations again were much more present but also significantly more present. The p value is shown on the y axis while the fold change is shown on the X axis and you can see that there are several populations of cells, all of which are T cells in different states that are either very highly different or have a higher significance between the two cohorts. And then we were able to then take the data that we were finding in the numbers and bring that back to the images using Visiopharm software to be able to identify that CD3, CD8, LAG3 and TIM-three cell is actually present and that this isn’t something that is makeup of the data or something that was misunderstood by the software.
We can visually find those cells present. So again, summary, SignalStar multiplex IHC is staining displayed strong specific signal in all four channels in all three of the imaging rounds, enabling twelve targets to be evaluated simultaneously in the TMA. And this is just the beginning. Since this study, we have been able to show sixteen and twenty four plex capabilities that are available, again, through literature that we can provide.
The Visiopharm’s Phenoplex software enabled visualization of over nine hundred distinct phenotypes in distinguished unique cell population between those cohorts. We saw that the T cells were very important between those two cohorts and there were a different variety of phenotypes that seemed to be again very differentially expressed as well as very specific to that patient cohort. And here’s the example of the sixteen plex and please let me know if you have any more questions or interest in understanding more about how to get to that fourth round. Again, sixteen antibodies added at once in the first round of imaging.
Therefore, CST is very excited to be able to offer solutions in spatial biology and enable and drive science forward. We understand that spatial biology is rapidly evolving and we have just scratched the surface And the foundation of all of these spatial proteomics capabilities and assays are a high quality antibody. Therefore, again, have over two thousand five hundred rigorously validated recombinant rabbit monoclonal antibodies that are validated for use in FFP or frozen tissue and specifically your mouse or human reactivity. So please make sure to look at that as an attribute of your antibody before moving forward with validating them within your panels.
In addition, the conjugation that we do for our direct conjugates, our secondaries, is one hundred percent in house, so we perform that validation both before and after conjugation so that you don’t have to. We have flexible tools and assays that are easily adaptable for different workflows, to the platform, enabling you to, whichever platform that you’re using, whether it is the BioTechniSpatial, a COMET, or the Akoya PhenoCycler, or just at your benchtop with a fluorescent microscope, we have a solution that is available in a format that is compatible with that technology. SignalStar specifically is compatible with the Leica Bond for automation as well as the BioCare Encore Pro X and the Parhelius spatial station for automation.
And the amplification of SignalStar enables accurate detection of these variable expressed targets, allowing you to translate discovery data into actionable knowledge.
Thank you for your time, and thank you to all of the collaborators that helped provide data and continue to collaborate with us to enable the next generation of spatial. Thank you.
Hello again.
Hey, Sarah. Hi. Thank you for the excellent presentation. I think we can get started with the q and a now.
Let me okay. Yeah. I saw this comment about the QR code on the slides that is not working.
I think it came through a little blurry, so we can make that available to customers or to to to the attendees through email as well if if Visiopharm will will help us with that. Yeah.
Yeah. Sure. We can we usually send the recording after the webinar so we can update the QR code and the content that was there as well. So alright.
Yeah. Mads.
He asked in the in the invasive margins, do you see myeloid cells changing from M1 to M2 as you get closer to the tumor, potentially seeing an in between zone with cells showing a hybrid M1 and M2 phenotype?
Or does the tumor simply attract M2 cells more strongly than M1s?
I believe we were seeing more M1 than M2 as we were getting closer to the tumor. The M2 were kind of sitting in that zone of the different M2 type, again, like cells were sitting in that zone together and next to the tumor, but the M1 were really very at the periphery, very, very close. We were actually seeing more of the M1.
I do think if you were able to look at this longitudinally, you would be able to see shifts, these cells shifting from more M1 like or more M2 like. So that’s something that I think has been documented in the literature, but it’s not something that we had done in our study.
In between the tumor simply, I think that answers the question.
Thank you.
I do have a question for you. What are some of the, let’s say, unique insights you can get when you combine SignalStar with Phenoplex?
Yeah. Absolutely. So I think when you combine it with Phenoplex, it really enables you to phenotype the cells very specifically and get down to all of these, again, nine hundred distinct phenotypes I was able to see in that one study. And it also enabled us to, again, to not only look at all those phenotypes within a single core, but across multiple cores. So we were able to look and compare and contrast across a variety of samples that were all different patient samples.
So I think that is really the value of Phenoplex for me is that not only can we define the cells within a single tissue, but multiple tissues in a TMA and make real conclusions that are differentiating these different patients’ cohorts.
Cool, thank you. So we have a question from Tina. When using SignalStar with more than sixteen antibodies, are all still given at the first step and is there a limit?
So yes, even beyond sixteen, all of the antibodies are added in the same step. That’s because all of the antibodies that are that we have available at CST, all of them have unique barcodes. So the limit is unknown at this point. We are currently trying to do a thirty two plex with SignalStar, where again, of the antibodies would be added at once and you would detect four per round.
So stay tuned if we can see we’ll keep pushing the limit and doing science with our collaborators to see what’s possible with SignalStar.
Cool. Thank you. And question from Johan. Do you know what causes the nonspecific nuclear staining after conjugation of the HER2 antibody you showed at the start of the talk?
We don’t know what would cause that particularly. It could be that there’s just some background because it’s fluorescent imaging that you could see just some background from the tissue itself when you’re trying to image and it’s just an artifact of the imaging itself.
It’s likely not the antibody binding to its target. It also could just be protein protein interaction of, again, nonspecific staining of the antibody itself, but we don’t know what causes it, but it’s very important for us to to distinguish that and see that, catch that in advance so that that we don’t approve an antibody that doesn’t work or conjugate that doesn’t work.
Yeah. That makes sense.
Stefano is asking, I’m starting I’m starting using signal star technology including eight markers. What software for image analysis you suggest?
Yeah. Absolutely. So we use the Visiopharm software in house to align the two images. There are other solutions, but the Visiopharm works really well for us using the tissue align software.
Okay. Cool. Sonja asked, how do I choose which protein detection is best for my needs?
So, yeah, so I showed a lot of options today. You can use direct immunofluorescence, indirect immunofluorescence. So again, directly conjugated antibodies are secondary antibodies that detect a primary antibody. So it is going to depend on a lot of things, the type of tissue you’re using and the type of platform you’re using, the targets you wanna detect. So again, the differences between a few of these protein detection methods is that SignalStar has the most signal to noise because it really amplifies that signal. So if you’re trying to detect a lot of functional markers or PTMs like post translational modifications, it might really require that level of amplification.
If you’re just trying to detect the CD markers that, in functional or phenotyping markers that define a cell type, you probably can use direct conjugates, it’s a much faster protocol to use direct conjugates. So I think it just depends on your needs. If you need the data in a day, direct conjugate, it’s a very highly expressed phenotypic marker, direct conjugates are gonna work really well for you.
Okay. Thank you.
We have another question from Mads. T cell exhaustion is not something I know well. So sorry if this is a dumb question. Is T cell exhaustion specific to effector T cells or is it seen in other T cells like Trex or GammaDeltas?
I would definitely wanna leave the details of this to a T cell expert as well. I am not the I don’t have a deep expertise in this area, but as far as I am aware that it is not specific to effector T cells, there are like when you say effector, if you’re talking like cytotoxic T cells, that this is not specific to cytotoxic CD8 positive T cells, that there are markers of exhaustion in CD4 T cells as well.
Cool. Thank you. Tina, what if the target I’m interested in is unavailable in the panel builder?
So, if the target you’re interested is not available in the SignalStar panel builder, then you have two options. You can look throughout our catalog for any antibody that is unconjugated that is validated for use in, frozen or FFP tissue for the species that you’re looking for, and it can be custom conjugated. You can request a custom conjugation through CST. We’ll conjugate it to one of those oligo barcodes that are unique from the ones that are already in the panel builder, and you can actually assemble your own custom pan panel with targets that we have or antibodies that we have in our catalog.
If you’re trying to instead use an antibody that you’ve developed in house or something like that, then you can use that secondary antibody solution where you would come in with your rabbit monoclonal or polyclonal or, you know, your mouse monoclonal that you’ve you’ve made in house. You would detect it with the secondary that has the oligo already conjugated to it, and then you would complete the rest of the SignalStar assay in the same way that it’s performed. So there’s two options depending on your needs.
Perfect. Thank you.
I think Stefano started with writing a question. So I’m not sure if it’s yeah. Okay. There we go. So investigating six markers all expressed on cell surface.
Three of these higher expressed and three lower expressed. What color combination do you suggest?
Yeah. Absolutely. For six, I would recommend using SignalStar because you can get again up to eight there. So you’ll have all of the channels you need.
And for the ones that are higher expressed, we do, have guidance that we suggest using the fluorophores that are a bit dimmer. So the three that are higher expressed, you may put them in the seven fifty channel or in the four eighty eight channel because they’ll do very well with those kind of dimmer fluorophores versus the lower expressed targets. I would put those in the six forty seven or the five ninety four. They are the, you know, some of the brightest of the fluorophores.
It doesn’t mean that it wouldn’t work in another way. We have validated all of the different fluorophore combinations for each of the antibodies. So it will work in however the panel builder suggests, when they when you build your panel, it actually will suggest the color combination. You can just go forward with that or you can kind of play around and try to, you know, get these lower expressed and pairing these with the the higher the brighter fluorophores.
Great. Thank you. Yes.
With that, if we don’t have additional questions, I think we can wrap up. I just gonna repeat that we we are recording this so everybody can rewatch at some point, and we will send the QR code that didn’t work during the presentation.
And, oh, another thing to let you know, guys, is that we have more webinars like this coming up on the next months, and we are updating our page. So you’ll get information around that. And we look forward to see you on the next sessions. But for now, thank you, Sarah, for the time here and presenting and sharing all these coincides with us.
So thank you for that.
Thank you. And thanks everyone for watching. We’ll see you next time, next month. Bye bye.
This spatial biology webinar explores how multiplex immunohistochemistry (IHC) enables deeper analysis of the tumor microenvironment and immune phenotypes.
Presented by Sarah Klein, PhD (Cell Signaling Technology), the session showcases how SignalStar® supports advanced spatial biology workflows and improves biomarker detection.
Why spatial biology matters
Spatial biology helps researchers understand how cells interact within tissue which is critical for studying cancer and immune response.
With spatial biology analysis, you can:
- Identify immune cell populations
- Map tumor–immune interactions
- Discover clinically relevant biomarkers
Multiplex IHC for spatial biology
SignalStar® multiplex IHC enables:
- Detection of low-expression targets
- Analysis of multiple biomarkers in one sample
- Strong signal amplification for improved accuracy
This makes it ideal for spatial biology studies of complex tissues.
Key insights from the webinar
- Immune cell patterns in the tumor microenvironment
- Differences between M1- and M2-like macrophages
- T cell exhaustion and disease response
- Identification of novel immune phenotypes

Sarah Klein, PhD
Sarah Klein, PhD is an Associate Director at Cell Signaling Technology with over 9 years of experience in the life sciences industry driving scientific strategy and innovation, and developing multiplex technologies like the SignalStar mIHC which you’ll hear more about today. Prior to joining CST, Sarah dedicated 9 years of research to the preclinical characterization of cancer therapeutics. Sarah performed her postdoc at Dana-Farber Cancer Institute using syngeneic mouse models of cancer to evaluate the cellular and molecular response to immune checkpoint blockade, and her PhD thesis research at MD Anderson Cancer Center investigating the therapeutic mechanisms of adenoviral-based vaccines for the treatment of brain tumors.
Sarah’s expertise lies in utilizing multiplex technologies, particularly multiplex imaging, to evaluate response to cancer therapeutics in order to identify novel targets for combination therapies and potential biomarkers.