Transcript
Alright. I think, we can get started. So welcome everyone to another edition of our special biology master class.
Today with me, I have James Pemberton from Standard BioTools. He’s gonna introduce himself in just a bit.
I just wanna let you know that this master class will take around twenty five minutes. And at the end, there will be a q and a. So you can write your questions in the chat, and we are gonna read at the end.
And yeah. So, James, welcome. Thank you for joining today. Do you wanna start with a short introduction of yourself and then you can get started?
Yep. Sounds great.
Hi, everyone. Thank you very much to Visiopharm for this opportunity to, present this here to you today.
My name is James Perrin. I’ve been a product application scientist with Standard Bio Tools for a couple years now. Recently, I’ve changed roles, and now I’m product manager for imaging reagents.
My quick background, I hold a PhD in medical biophysics from the University of Toronto in Canada. And I come from a background in microscopy, primarily, like fluorescence confocal microscopy, and fluorescence lifetime imaging microscopy.
I I’ve done various things, for example, like studying different cell death signaling pathways, observed in cancer and neurogeneration.
But today, I’m excited to speak with you about a different and unique approach to imaging cells and tissues.
So part of this talk today will discuss, the instrumentation that’s available from Standard Bio Tools for studying spatial biology. And then part two will cover, Visiopharm’s, Phenoplex image analysis that can be, utilized.
So to get started, what is spatial biology?
Spatial biology is a field that focuses on understanding the spatial organization of cells within their native tissue environments. So unlike traditional methods that may, like, dissociate tissues into single cells, like single cell transcriptomic transcriptomic technologies, spatial biology preserves the context of where cells are located, in relation to one another within a tissue. So this approach allows for deeper comprehension of cellular behavior interactions, and the microenvironment within complex tissues such as those like tumors or normal tissue samples.
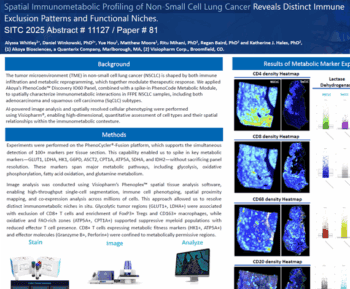
So for example, I’m showing you here data collected by our research and development department.
The image of human glioblastoma tumor, you can observe this on the left, and we also have a normal mouse brain tissue section on the right. What I hope you can appreciate is the, vast heterogeneity of protein expression within both diseased and nondiseased, tissue examples. So by revealing the spatial locations and interactions of cells, spatial biology provides those critical insights into health and disease progression and potentially to better therapeutic, targets.
So typical immunohistochemistry or immunofluorescence has been the starting point for a lot of spatial biology studies. But as the field rapidly progresses, we need tools that can keep up with the total amount of targets that need to be studied, the ever increasing throughput of samples to process, and then, of course, image analysis solutions to make sense of all this data.
So this is where I’d like to introduce you to, Standard BioTools.
We’re formerly known as Fluidigm.
We have a fleet of proteomic and genomic high throughput and highplex solutions.
For example, if you’re looking for ultra highplex protein profiling from samples with as low as fifty five microliters, well, the Somascan assay could be the solution for you that utilizes Somamer technology.
If you’re looking for high parameter single cell protein analysis, our instrument for this is the CyTOF XT, which, excels at cytometry by time of flight technology. I’ll go into a little bit more detail about this technology later in the presentation.
Or finally, if you’re looking for a high throughput nanoscale next generation sequencing library prep, the BioMark x nine system is great, solution for this as well as multiple other use cases in genomic analysis.
But for today’s presentation, it’s all about spatial biology. And today, we’re gonna be discussing the Hyperion x t I imaging system. This is Standard Bio Tool’s latest platform for studying spatial biology.
So some specifications about, this instrument, the Hyperion xTI imaging system, it utilizes imaging mass cytometry.
I’ll go into the details of that technology in just a second, but just to keep it high level, this instrument is used for analyzing spatial biology of tissue sections that fit on your standard microscopy slide. It has a capacity to visualize forty three unique targets all at one time on a single tissue sample.
So for myself, coming from a background of standard immunofluorescence, live cell imaging, I shifted from looking about three or four targets at one time to now forty plus targets. And it’s been quite the eye opening experience, going to that highplex scale.
In addition to the number of parameters you can measure at once, this instrument is built for sample throughput.
New this year, the Hyperion x t I now comes with an integrated slide loader. So as a user, you can stain and load forty tissue slides, each stained with forty plus antibodies, and you can process all of your samples within twenty four hours.
So this is truly remarkable scale and speed, that you can work at work in for spatial biology.
So why did Standard BioTools make this instrument? Well, I like to share a particular use case with you.
This was presented by doctor Jennifer Gorman. She’s a scientific associate and lab manager at the Lunenfeld, Tenenbaum Tenenbaum Research Institute. She presented this work at, the CITOF Summit earlier this year. And if you’re curious to see her full presentation, this webinar, you can find this on Standard Bio Tools, website.
But what Jennifer Gorman sought to do was characterize a cohort of forty two patients with high risk prostate cancer. And our team wanted to find proteomic differences between, Gleason pattern four and Gleason pattern, five histologies.
A Gleason score, it it’s a grading system specific to prostate cancer.
So then they would they wanted to assess the proteomic features, and assess this in relation to the clinical measures and the outcomes, right, for the patients.
So in total, it’s a cohort of forty two patients, but they had a hundred and twenty five whole slide tissue sections that were stained with a forty antibody panel.
This very large forty antibody panel was needed for her team to identify multiple parameters within the tumor samples. For example, identifying multiple kinds of immune cells, lymphoid and myeloid cell types, markers to study hypoxia, cell proliferation, cell death, metabolic markers, etcetera.
So a very high parameter antibody panel on many, many samples.
Doctor Gorman, they actually estimated how long it would take to acquire, this data running on our, previous generation, imaging platform. This was just called the Hyperion, and it ran at a two hundred hertz frequency.
They estimated it would take almost seven years to actually acquire all of this data, utilizing that instrument, which obviously is ridiculous and not realistic.
But with our latest Hyperion XTI instrument, including the new slide loader, it actually only took them about forty two days to collect and process all of this data. So, again, that one hundred and twenty five whole slide sections, each of them being stained with a forty antibody panel.
This example, it really important to highlight because if we want to answer questions within spatial biology, high parameter targets and high throughput in processing of samples, these are some of the two key fundamentals that will drive biological insights.
So what did, doctor Gorman’s team find? Well, they are still preparing their manuscript.
But when they looked at individual patient data, one of the remarkable things they discovered is the extent of heterogeneity within tissue samples from a single patient.
Meaning, within a single patient, multiple Gleason scores could actually be assigned to the tumors, and it really just depended where you looked within the tumor sections.
So this has significant implications, of course, for how we study prostate cancer, how it should be classified, and it also can help drive, biological insights into the progression of the disease.
Okay. Switching back now to the actual instrument itself, the Hyperion XTi.
It this instrument thrives in in studying high parameter, high number of parameters and a high number of samples to be processed at one time. So how does this underlying technology work?
This is a workflow is very simple, and it’s very, comparable to immunohistochemistry or, like, immunofluorescence, for example.
You start by taking your antibody panel, applying the stain, to your tissue samples on your microscopy slide. You insert the sample into the Hyperion XTi, collect your image data, and then proceed to, image analysis.
Later in the presentation, like I mentioned, I I’ll discuss some of the advantages to using, Visiopharm’s Phenoplex software for analyzing Hyperion XTi, data.
But how does this underlying technology work altogether?
As I mentioned before, this instrument utilizes imaging mass cytometry.
Essentially, we’re generating tissue images without the use of light.
In conventional immunofluorescence, you would utilize antibodies conjugate it to a fluorophore and then illuminate the fluorophore to capture, the tissue image.
With imaging mass cytometry or IMC for short, we utilize antibodies conjugated to unique metal isotopes then detect these metal isotopes with time of flight mass spec.
So within a forty antibody panel, we’re detecting forty unique metal isotopes not commonly found in biological systems.
Within the instruments, a laser beam, it ablates the tissue, sending the tissue and the antibodies to be ionized with plasma.
Next, low mass ions are removed, and the remaining ions ions are separated by, time of flight and identified.
So, essentially, we’re identifying the metal isotopes that are present within the tissue where the laser beam, was, on the tissue its, slide itself. Then we’re digitally creating the tissue image pixel by pixel.
So this method methodology has several key advantages in comparison to fluorescence based methods.
First, we’re not using, fluorescence at all.
So the generated images do not display any autofluorescence signal.
This is actually quite advantageous if you’re working with highly autofluorescent tissue specimen.
Secondly, if you are familiar with fluorescent spectra, you’ll know that excitation and emission spectra, they’re quite they’re very wide and broad and they do have significant overlap with, multiple other fluorophores.
But with IMC, imaging mass cytometry, the detection of metal isotopes using time of flight mass spec results in very discrete signal signatures, giving you the confidence that the signal you detect is uniquely associated with an individual target in your panel.
Another advantage to IMC, are the unique imaging modes available.
Because we are using, a laser scan across its tissue section, there are numerous ways we can, sample our data.
So here are three of the imaging modes that I’d like to introduce you to.
The first one I’ll introduce you to is can be seen here in the middle of the screen. This is called tissue mode. Tissue mode is our whole slide imaging modality. It’s fantastic for generating large, tissue scans. Depending on the size of the tissue, an entire tissue section can be scanned in a matter of hours, generating data for the entire forty antibody panel that you stain with.
Next is preview mode.
Just as the name implies, utilizing preview mode as seen here on the far left.
Utilizing preview mode generates a preview, of the whole slide image.
This is extremely helpful, for certain scenarios. For example, like, if you imagine, if you’re able to visualize the expression of all forty markers across your entire tissue section and if you can acquire that preview image in just a matter of minutes, usually it’s on the scale of, like, ten to twenty minutes depending on the size of a tissue, that that really opens the door and really demonstrates the heterogeneity that spans the entire tissue section. And that’s information that’s spatial biology information you can collect within a matter of minutes. So extremely helpful for this.
The the resulting image that is produced, can help you make qualitative assessments. So for example, let’s say after collecting your preview mode image, you discover that there’s high expression of a particular marker of interest in a certain area on the tissue.
You can then select this region of interest and begin collecting single cell resolution data utilizing cell mode.
So cell mode, seen here on the far right on the screen, is the last imaging mode that I’d like to introduce you to today.
As the name implies, it’s the imaging mode to, be utilized if you wanna get single cell resolution.
And the resolution we can achieve is zero point five to one micrometer.
The resulting images can be processed with, single cell analysis solutions.
This is especially important for identifying the look localization of signal. So for example, for each antibody, you may need to know is a signal localized to the nucleus of a cell, because it’s detecting a transcription factor, or is the signal located within the cytoplasm of a cell, or is it located on the plasma membrane? All of this the spatial context of where the signal is actually present within the tissue or within the cell is extremely important for answering your biological questions.
Depending on the size of the region selected, this imaging mode is on the order of, minutes to hours, for completion.
Okay. Diving in a little bit further on these imaging modes. Here in this example, I want to highlight the power of combining preview mode with cell mode imaging. So here on the screen, you can see is, a sample of human tonsil tissue section. And for simplicity, I’m only showing you, three markers. CD three in red, collagen in green, and DNA DNA fine blue.
Just showing you these three colors for simplicity.
But as a reminder, you can visualize all forty plus markers with preview mode.
So in this example, you can visualize a CD three, t cell marker, signal. And what you can see here in the image, actually, sorry. Let me back up there for a second. Because preview mode does, subsampling, with of the tissue itself, the image does appear a little bit pixelated.
But the fact that you can acquire this image in about ten minutes is where the true power comes from. It provides a wealth of qualitative information, and spatial relation of where your markers are being expressed in the tissue. So here you can clearly see, lymphoid follicles and germinal centers, denoted by the surrounding CD three, red signal.
So the capability of to image the entire tissue section within minutes enables you to capture the full picture of the heterogeneity across the whole tissue section.
And this is what really informs you to make, decisions on the regions of interest to go in and collect data for cell mode.
So after identifying particular regions of interest, you can collect cell mode data, which is at the single cell resolution.
And here in the animations, I am overlaying the cell mode image data on top of the preview mode data. And I’ll flip back and forth just a little bit here so you can appreciate that the spatial information that you acquired with preview mode is fully conserved with cell mode. And then but of course, with cell mode, now we’re getting down to the one micrometer resolution that we need for the single cell resolution.
This workflow, it provides the fastest way to visualize whole slide heterogeneity and ensures you collect the single cell resolution data where it matters most. So instead of collecting single cell resolution data for an entire sample or tissue section, where more than half of which you probably wouldn’t even use for the image analysis, you can now visualize a signal distribution across the entire tissue section and move in, for those particular regions of interest to collect your single cell, resolution data with cell mode.
Okay. Again, this in this example, this is a human tonsil sample again. And here, I’m just zooming in on the cell mode data so that you can visualize the, single cell resolution that can be achieved with the Hyperion XTI imaging system.
The preview mode image and the cell mode images were all produced from the same slide, so there’s no need for, serial tissue sections in this workflow.
Now I’d like to present an example of tissue mode.
Imagine a scenario where you have a very large, tissue section and you want to do whole slide imaging.
Preview mode is excellent choice if you want to make qualitative assessments on the on the, expression of markers across tissue and then proceed to cell mode. But what if you actually want to capture everything across the whole slide?
This is where tissue mode shines best. So you can imagine if you have no prior knowledge on the heterogeneity and expression of markers in your tissue sample, if you solely focus on a small portion or region of your tissue, you could be missing out on such a much greater and larger big picture.
So, TISS mode, our whole slide imaging modality, is fantastic for generating large tissue scans. In this particular example, I’m showing you a large five square centimeter, human colorectal tumor sample, and this sample was imaged just in a matter of a few hours.
So with the ability to measure the whole tissue section in just a few hours, we can identify distinct areas within, this tissue section where there’s different biological processes happening. So, for example, in the yellow box, you can see here on the right.
You can visualize tumor infiltrating lymphocytes denoted by the CD forty five, magenta signal.
And then you can see how the CD forty five signal is encountering antigen presenting cells represented by the HLA Doctor yellow signal.
Or as you can see in the middle white box, you can identify other structures within tumor sections. In the middle box here, you can see we identified a tertiary lymphoid structure.
So tissue mode generates images at a resolution of about five micrometers.
Quantitative analysis can be done utilizing pixel clustering analysis or by using Visiopharm’s tissue segmentation app, which I’ll dive into a little bit further on here.
Okay. First, I’d like to explore a little bit now into the, data analysis that occurs with, the image data that comes from Hyperion XTI.
You can utilize a variety of image analysis solutions. So for example, ImageJ, Halo, CellProfiler, and, of course, you can use Visiopharm’s, Phenoplex software.
Two things to note. The first being that with the purchase of a Hyperion x star instrument, you do receive a one year license for Visiopharm Phenoplex.
And then secondly, if you do wanna take advantage of Standard Bio Tools IMC services, our discovery lab, imaging mass cytometry services, they’ll process your data utilizing Visiopharm’s Phenoplex software.
Okay. To start, the file that’s exported from the Hyperion XTI, it’s called an MCD file. You can extract the OEM, TIFF files for each marker and then proceed to analysis.
Alternatively, Visiopharm makes it easy, and you can directly open MCD files within Visiopharm.
In this first view of the software, you can visualize all the channels, assign pseudo colors, and adjust image brightness and contrast.
You can also create groups. That’s what you can see here on the far right that I started doing.
Any group really depends on what it is that you are studying. In this example on the far right, you can see I’ve created a group called, just t cells. And this group is defined as the expression of CD forty five, CD four, and, CD eight, all of which were antibodies included in my panel.
Another group potentially you could do would be, tumor cells or epithelial cells. Maybe you’re looking to identify, cell types associated with, blood vessels or infiltrating immune cells. It it really depends on the biological question you wanna answer. But the main take home is you can create these groups, and the groups are defined as the markers that you assigned from your panel.
So when processing your cell mode data, as a reminder, this is your single cell resolution data.
You need to first do, cell segmentation.
To answer your biological question, it’s important to distinguish the location of signal. Is it within the nucleus, cell body, across the entire cell? This is all information you can extract using, Visiopharm Phenoplex.
So to do this, you first start off by using the cell detection app. It utilizes AI to automatically identify individual nuclei and cells, and it can be used for, batch analysis for all your image data. We find this image we find the segmentation app actually, quite accurate when, analyzing our data.
Phenoplex also has some other, useful tools. So for example, there’s measurement tool. Oh, I think I went ahead to buy one slide.
A few other useful tools that you can utilize, once you segment yourselves as well. Measurement tool, if you wanna quickly determine the size of structures within your image data. An annotation tool, if you wanna create a note based on the visual observations, and a few other tools that are quite useful, especially if you need to revisit your data later on, something that usually happens.
The next step in the image analysis, using Visiopharm is to, apply a thresholding or gating. So you need to determine what signal, should define objects of interest in your data. So in this particular example I am showing you, I’m creating a gate to determine what CD three expression should define a CD three positive t cell.
And then in real time, you can then visualize so the gating here is on the left. And then in real time, you can visualize what cells fall within your gates, on the right. So on the right, you can see this is the cell mode data. You can see the segmentation mask, and you see these individual yellow dots represent the, cells that fall into my defined, threshold gate that I applied.
Okay?
What else can I tell you for this slide?
I think that’s it for this one.
Now that we’ve, done the cell segmentation, we’ve done our thresholding and gating, now we’re at the point in the analysis where you can actually start to answer some of your spatial biology questions.
So, for example, utilizing the, co occurrence matrix, This can tell you the occurrence of two or more markers within the image data. So in this example, we created a co occurrence matrix for seven markers, and this co occurrence matrix is telling us right now that about ninety five percent of the CD twenty positive cells are also CD forty five positive.
And this, of course, makes biological sense, knowing that CD forty five is a pan leukocyte marker and CD twenty is a b cell marker. So we, of course, expect a very high co occurrence to occur.
Visiopharm also has multiple neighborhood analysis tools available. These are extremely important in the study of spatial biology as we want to understand the spatial context within the tissue sample. So this first tool is called, neighbor counts.
Essentially, if you imagine you have a cell located within your tissue, and let’s call it a c d three positive t cell. The question you wanna ask is what kind of neighbors or other cell phenotypes are within a certain distance of this kind of t cell?
You can adjust the distance for proximity. One to thirty micrometers is the default set in the software, but it really just depends on your research question. If you’re asking what phenotypes are in close proximity to your target phenotype, it then provides you a mean standard deviation count and tells you, what these close proximity cell types are.
Now in relation to this, another very important spatial biology, spatial analysis tool is the nearest neighbor tool that Visiopharm has.
So, neighbor counts helps you identify the neighbors or the cell phenotypes, what they are. Nearest neighbor tells you how close are the cells together, providing you a mean distance, for the different cell phenotypes.
So continue our example here. You can use neighbor counts to identify the cell phenotypes that are in close proximity to the CD three positive t cells. Then you can use nearest neighbor to tell you how close are these cell phenotypes to the CD three positive t cells within the tissue.
This can help you identify cells that may have, functionally direct interactions with each other, cells that may be part of the signaling network.
And, for example, like, the proximity of certain immune cell types that can really help inform you of the immune response that may be occurring within the tissue sample.
Again, it comes down to what is your biological question.
Utilizing both neighbor counts and nearest neighbor tools, it’s essential to answering a lot of your spatial biology questions.
Okay. And then finally here in the, analysis, what I shared with you so far is a quick overview of the image analysis that can be utilized for cell mode data, at that single cell resolution. But Visiopharm Phenoplex, it does also have some solutions available for tissue mode data.
So the most useful of of this would be the tissue segmentation app that they have.
It enables you to identify specific regions within the tissue based on, marker assignments. So for example, you can create an image classes names like tumor, non tumor, and you can train the app to recognize parts of the tissue as tumor based, on the based on the expression of, the certain markers that you assigned. And then you can use this AI to do batch tissue segmentation on all your tissue mode data.
So extremely useful for segmenting and identifying different regions, on your tissue mode data.
Okay.
Wrapping up, this presentation here for today, I know I’ve thrown a lot of information at you here.
We’ve reviewed the Hyperion xTI imaging system. We learned how imaging mass cytometry works. We explored the different imaging modes available with the Hyperion xTI, and we got a taste of the, image analysis solutions offered with, Visiopharm’s Phenoplex software.
All of this, I understand, it can be a little overwhelming, especially to users who may be new to multiplex spatial biology. Getting started may seem like a, daunting task.
So for example, starting at the very beginning, how do you design a forty antibody panel? Well, at Standard Bio Tools, we do offer preconfigured antibody panels. We now have over twenty five IMC panels currently in our catalog, each relating to, different research applications. So for example, human or mouse immuno oncology, neurogeneration and phenotyping, t cell exhaustion, tissue architecture, etcetera.
Starting with one of our preconfigured panels makes the process of designing your, high parameter antibody panel that much easier.
Plus, you can also bring your own antibodies. If there’s a target not available in our catalog, you can easily add it to our IMC pan you can easily add it to your IMC panel, so long as it has some previous history of working with immunohistochemistry or immunofluorescence, the clone will most likely work then with imaging mass cytometry.
The last thing I just wanna mention here today is that if you are looking to get started with imaging mass cytometry, a great place to start is with Standard Bio Tools Services.
You can ship your FFPE or fresh frozen slides, and you let our scientists do the work for you. Our scientists, they’ll do the antigen retrieval, the antibody staining, the data acquisition, and the analysis for you.
So you can use our services to gain, pilot data.
You can gain spatial proteomic data to complete that manuscript that’s currently in the works, or you can, utilize it to gain data for grant applications.
It really depends on your, particular use case. But our scientists, they provide the data analysis for you, utilizing Visiopharm’s Phenoplex software as I just showed you here today.
So with that, thank you all very much for your time and your attention today. I’d be more than happy to answer any questions that you may have.
Well, thank you so much. Let’s get started with the q and a.
First question, you talked a lot about Phenoplex. I’m just curious. What is if you had to choose one thing about Phenoplex that you love the most combined with Hyperion images, what is it?
Good question.
I think what’s one of the one of the very useful, tools is or abilities is the fact that you can just directly take the raw data that comes off the instrument, the Hyperion xTI. This is the MCD file. And the fact that you can open it and start processing your data using Visiopharm Phenoplex. So you don’t have to go through the trouble of trying to convert all of the image data to the OEM TIFs first, trying to export, save them somewhere, and then try to reimport them into Visiopharm.
That’s one really nice thing I appreciate with the, software.
Cool. Thanks for sharing. So I can see that we have some questions already.
So, Rasmus, he wrote a question, I think, at the beginning of your presentation when you were presenting the case study, I think.
So he asked, is that twenty twenty four hours total acquisition time for the entire whole slide for all forty slides in this slide loader at one micrometer resolution?
Yep. That’s referring to, I think the one slide where I introduced the Hyperion XTI, and the slide loader as well. Yeah. So we advertise it as, you can do forty slides, forty antibodies, and you can accomplish this in twenty four hours. In that particular example, each slide, you’re selecting, I believe, three regions of interest, to collect cell mode data. So in that example, that’s not collecting data across the entire tissue section. That’s, three individual regions per tissue slide.
If you wanna get a general sense of how long it takes to acquire data, with the Hyperion XTI, it it really comes down to, area. So other technologies like cyclic immunofluorescence, the amount of time to acquire all of your data is dependent on the size of your antibody panel.
For us, the, determination the determining factor for how long it takes to acquire data is the, area of the tissue itself.
So larger area takes a little bit more time. Smaller area, smaller time.
Cool.
Thank you.
So let me see. Question from.
Can you quantify expression levels?
And have any anybody tried staining for post translational modifications, like phosphorylation?
Have you tried to reconstruct a whole tumor treaty?
Oh, good question.
On the three d front, I know of two publications.
Your name the titles of the publications are are escaping me. There’s two publications available where, two independent groups looked at doing, three d reconstruction using imaging mass cytometry.
Now one approach could be you could do multiple serial sections of a tumor. So if you have multiple serial sections, each section you would stain with the same antibody panel. You would then process each one individually, and then you can do, digital reconstruction to create the three d image.
Another approach is actually, taking a much thicker, tissue section, staining it with your antibody panel, and then, doing subsequent scans on that tissue. So for imaging mass cytometry, how the technology works, it’s a laser that goes across tissue section and ablates a very small layer of the tissue. So, essentially, what you’re doing is you’re just you’re continuously ablating a smaller and smaller layer of the tissue. You You collect that IMC data, and then you can reconstruct that, into three d.
Sorry. I have I think that was part two of the question. Was there a part one?
Can you see the chat? Can you quantify expression levels?
And have Oh, can you quantify expression levels?
Really good question.
Depends how what you mean by quantify. If you want, absolute quantification, that currently does not exist. But if you want to, with the with the Hyperion XTi, the the dynamic range of signal you can detect within a single sample, you can detect, very low signal, and you can also detect very high signal. The dynamic range for, epitope expression is quite large. So this is quite useful in studies where, you might want to, like, stratify, samples based on the expression of a certain marker and you wanna be able to capture that entire range.
That you can do, what’s it called, qualitative, expression levels.
Great.
So next question from Ali. How many parameters do you recommend to get an optimal segmentation?
Is DAPI only enough to work on IMC data?
Yeah. Great question as well.
So how many parameters do you recommend? We do offer a, cell segmentation kit.
This kit is, three antibodies that binds unique targets on, cellular membranes. So if you use the segmentation kit, three markers to identify different regions of the membrane, and then you use, not DAPI because DAPI, you would use to identify, nuclei for inflorescence technologies. For us, you’re gonna use, iridium metal. So iridium, one ninety four, I believe.
So you’ll have your one DNA channel to identify the nuclei, and then you’ll have three markers to, help identify the cell membrane.
Thank you.
Next question from Matt. Since IMC works with wear metals, could you use no antibody conjugated metals for a for IMC?
For example, loading micro vesicles with specific rare metals and then use IMC to detect where they end up in a tissue slide?
That’s a great question.
Yes. You can, technically.
I have to go look at some literature for this, but what you are detecting is the metal isotopes. So whether or not these metal isotopes are conjugated to the antibody, or in another application that I’ve personally done myself, if the metal isotope is conjugated to an oligonucleotide for detecting, different transcripts in the tissue, that also works.
Or in your particular example there, yeah, if if the metal if that specific metal isotope is somewhere found within the tissue, we should be able to detect it with imaging mass cytometry.
Cool. Shannon is asking, is there any information on what markers are used in the cell segmentation kit?
That I would have to go back. I’m not I think that’s proprietary, that we have on the segmentation kit itself.
It’s it’s three three unique, cell membrane protein markers.
Stands usually most different cell types or tissue types that you would encounter.
Okay. And Sonia asked if someone is designing their antibody panel to be used for imaging mass cytometry, where do they get the metal tagged antibodies?
What if they cannot find a particular clone that they want?
Yep. Great question.
So there’s a few different options that you can go with. Like I mentioned, if you have an antibody or clone that’s worked well with immunohistochemistry or immunofluorescence, it’ll most likely work on imaging mass cytometry like the Hyperion xTI platform.
You can start by looking at our catalog of preconjugated, clones and clones with different metal tags to build your panel. If you can’t find a clone of interest and you have one yourself, you could either conjugate the antibody yourself with the metal tag. We sell a conjugation labeling kit for this. Or you could actually send in the antibody to us, and we provide custom conjugation services. So we’d be able to put the metal tag on for you, send it back, and then you could proceed with your, imaging mass cytometry experiment.
Cool. Thank you. I believe that was the last question.
So if anybody has additional questions at some point, we are gonna send an email with the recording. And, yeah, you can always get back to us or James. James, thank you so much for the master class. It was really great having you here and everybody that engaged. It’s always so nice to see you here.
We have a last minute question, actually, from Narek.
Will that conjugation service be available for other commercially acquired labs or ABS?
For commercially acquired antibodies? Yeah.
Any antibody that you can buy from a commercial vendor, one that you might have sourced from your own lab, you just send it to us, and we conjugate it to you as a service, and we ship it back to you. Or if you want to go through our discovery lab services so so that you could access the Hyperion XTI, through our service lab, you could still send in the antibody. We’ll do the custom conjugation, and then we’ll apply it to your sample, when we run the experiments.
Perfect. Thank you once again.
And, yeah, thanks everyone for joining.
Thank you. So, yeah, have a great day, evening, morning, everyone, depending where you are.
And don’t forget to follow us on LinkedIn as well. We are always promoting our Mastercard series there, so you would know when there’s a new one, when you can rewatch the recordings.
So Fantastic.
Thank you.
Thank you very much. Thank you.
Bye, everyone.
Join us for an insightful seminar on the Hyperion XTi™ Imaging System and its pivotal role in advancing spatial biology. This emerging field is transforming our understanding of tissue organization in health and disease, with implications for predicting immune and therapeutic responses, improving drug development strategies, and potentially preventing or curing diseases.
While conventional microscopy techniques use fluorescence to visualize protein or RNA targets in tissue samples, they face challenges due to spectral overlap and tissue autofluorescence. The Hyperion™ XTi overcomes these limitations by utilizing Imaging Mass Cytometry™ (IMC™), a fluorescence-free approach enabling detection of 40+ targets.
IMC has expanded its capabilities with new whole slide imaging modes, which include Preview Mode, Cell Mode and Tissue Mode. These modes facilitate rapid and detailed analysis, supporting automated, continuous imaging of more than 40 large tissue samples (400 mm²) weekly. This significantly accelerates researchers’ ability to gain insights from complex biological samples.
Phenoplex™ software from Visiopharm® complements this hardware by offering a comprehensive workflow for data analysis, including automated ROI selection, phenotyping and spatial analyses of IMC images. This seminar will demonstrate how the multi-modal features of Hyperion XTi, combined with advanced analysis tools from Visiopharm, are revolutionizing our approach to spatial biology and opening new avenues for biological assessment.

James Pemberton, PhD
James holds a PhD in medical biophysics from the University of Toronto, specializing in advanced fluorescence microscopy techniques, cell biology and cell signaling mechanisms. At Standard BioTools, he currently works within product management and collaborates with R&D teams to leverage the multi-plex capabilities of the Hyperion XTi Imaging System. His goal is to drive innovation in spatial biology, enhancing our understanding of complex cellular interactions and tissue architecture in both health and disease.