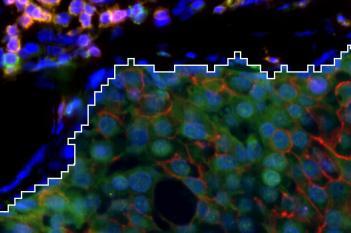
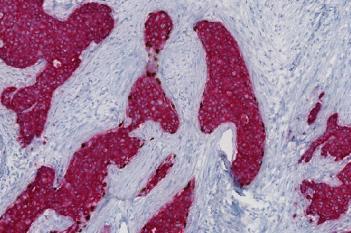
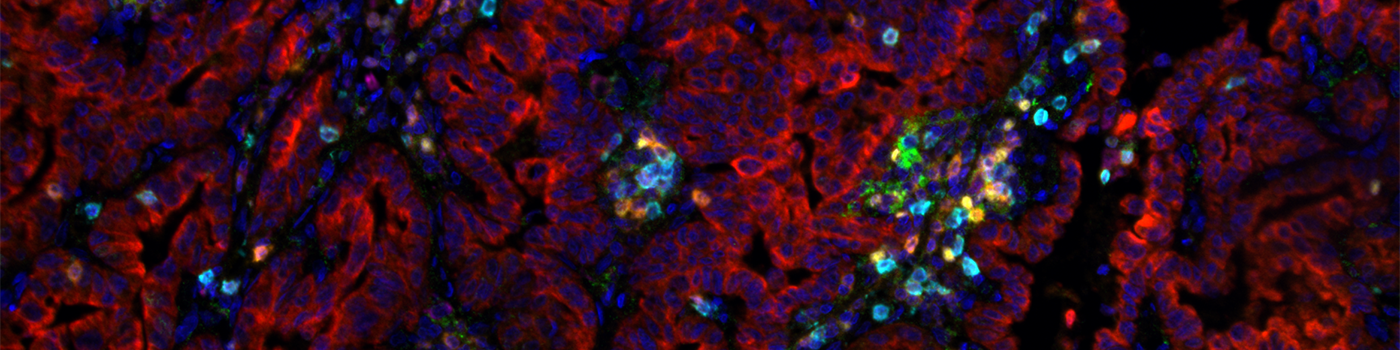
Part of a raw multiplexing image

#10166
Developed for Akoya Biosciences, Inc.
The widely used biomarker panel for lung cancer (CD8, PD-1, PD-L1, CK, CD68, FoxP3 and CD68) was developed to understand immune infiltration in the face of a PD-L1 blockade. It can be utilized to assess (a) the change in the immune interaction across the tumor-stroma interface and (b) the composition on either side of the normal-tumor invasive edge. Phenotypes are identified using the Multiplex Phenotyping module. This APP is designed to work with amplified fluorescence signals that have been unmixed with multispectral imaging, in which each stain is spectrally isolated from both spectrally overlapping fluorophores and background autofluorescence.
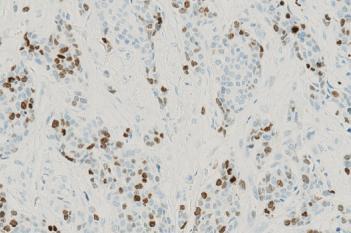
Part of a raw multiplexing image
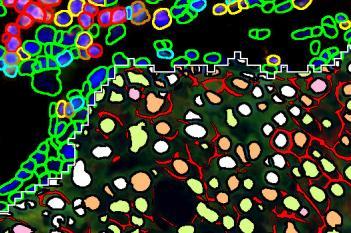
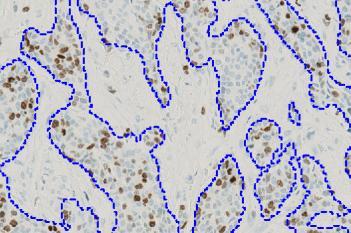
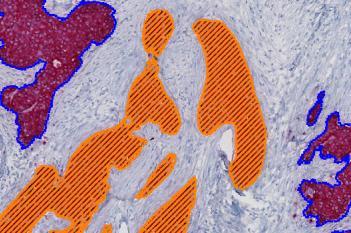
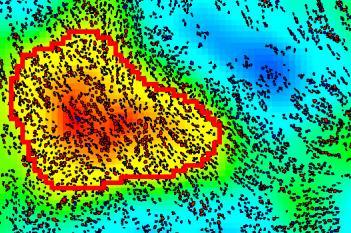
Automatic tumor detection based on the presence of CK staining

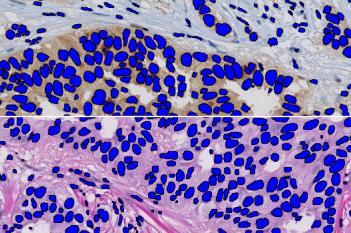
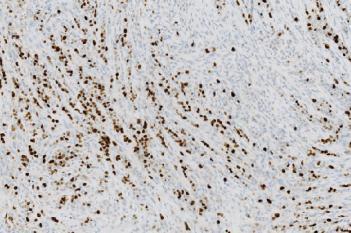
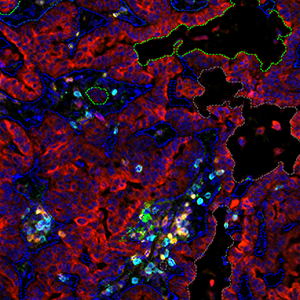
Automatic cell segmentation based on the presence of DAPI staining and automatic identification of phenotypes based on the trained phenotyping APP

Generated t-SNE plot showing the detected phenotypes
Auxiliary APPs
APP: “01 Tumor Detection” The auxiliary APP ”01 Tumor Detection” is used for automatic tumor detection
APP: “02 Find Cells” The auxiliary APP ”02 Find Cells” is used for automatic identification of cells
Quantitative Output variables
The output variables obtained from this protocol are:
The APP also outputs the total number of cells positive for different combinations of markers in both tumor and stroma. For a full list, please contact us.
Workflow
Step 1: Load and run the APP “01 Tumor Detection” for tumor identification
Step 2: Load and run the APP “02 Find Cells” for cell identification
Step 3: Load and run the APP “03 Phenotyping” is used for division of the cells into identified phenotypes
Methods
The tissue is initially segmented into tumor and stroma based on the presence of cytokeratin staining. Following tissue segmentation, individual cells are identified based on the presence of DNA (DAPI) and membrane proteins where available. The unsupervised phenotyping algorithm is trained across multiple images resulting in identification of cellular phenotypes. The trained APP can be used for division of identified cells into the identified phenotypes. The phenotypes can be counted and further visualized in a Phenotypic Matrix, Phenotypic Profile and/or tSNE plots for a better understanding of the data.
Staining Protocol
Akoya Biosciences’ Opal Multiplex IHC Detection Kits [1,2] are used.
References
USERS
This APP was developed for Akoya Biosciences, Inc., a company dedicated to the field of multiplexed biomarker analysis and immunofluorescence tissue analysis.
LITERATURE
1. Akoya Biosciences, Inc. PhenoImager Assays (Last updated: April 2023)
2. Lu, S. et. al., Comparison of Biomarker Modalities for Predicting Response to PD-1/PD-L1 Checkpoint Blockade: A Systematic Review and Meta-analysis, JAMA Oncology 2019, 5 (8), 1195-1204, DOI