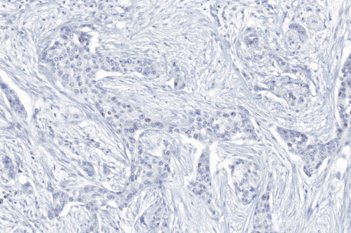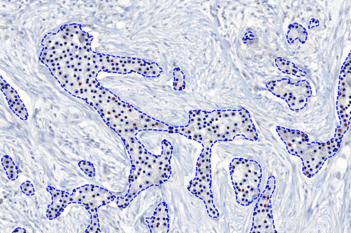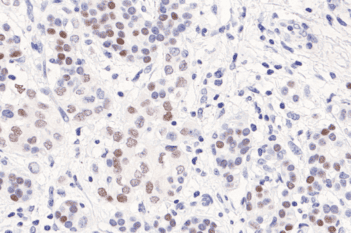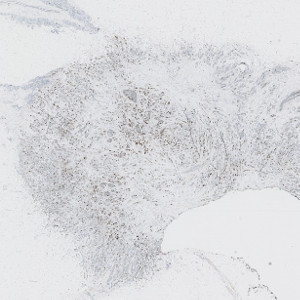
Ki-67 stained slide.
#10114
One approach to Ki-67 scoring is the hot spot scoring method, which is recommended in many countries. But defining and assessing hot spots manually can be challenging.
The Hot Spot APP is independent on biomarker and tissue type, and may be used for analysis of biomarkers different from Ki-67 and on indications different from breast cancer. The APP can be configured in numerous ways, and can be customized for different use cases. The default Hot Spot APP configuration is the same as used in article [1], where it was shown that digital image analysis of Ki-67 in hot spots is superior to both manual Ki-67 and mitotic counts in breast cancer.
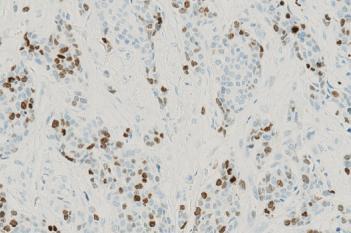
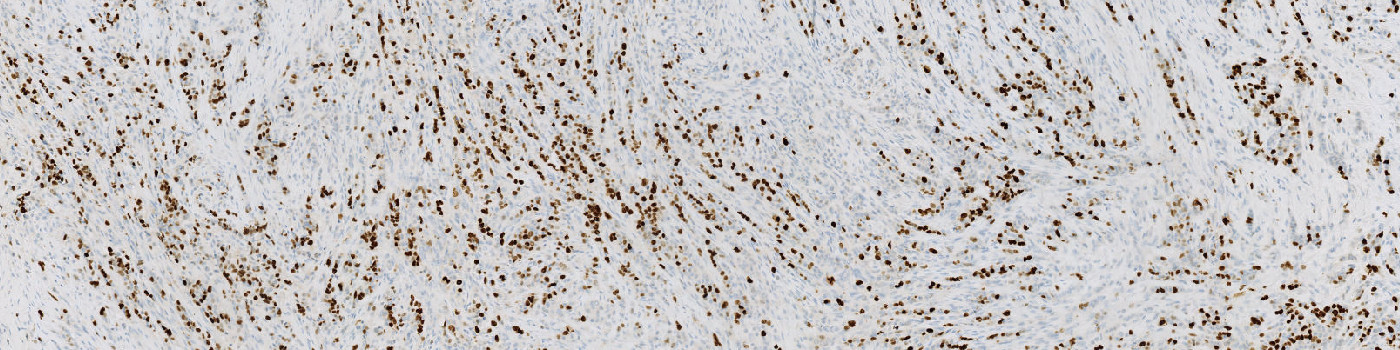
Ki-67 stained slide.
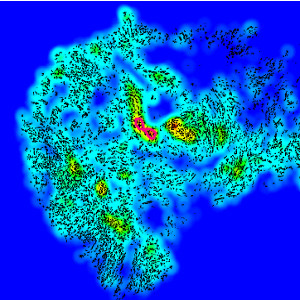
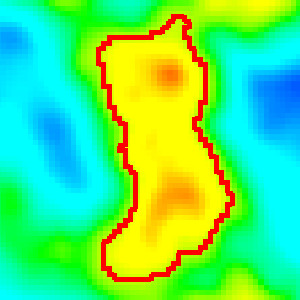
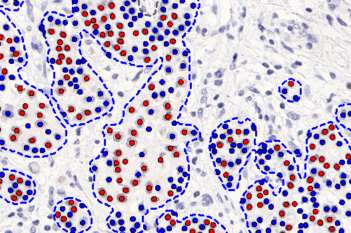
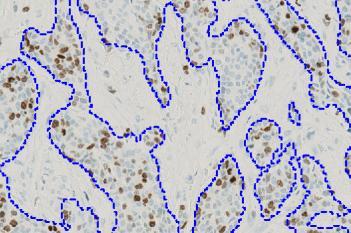
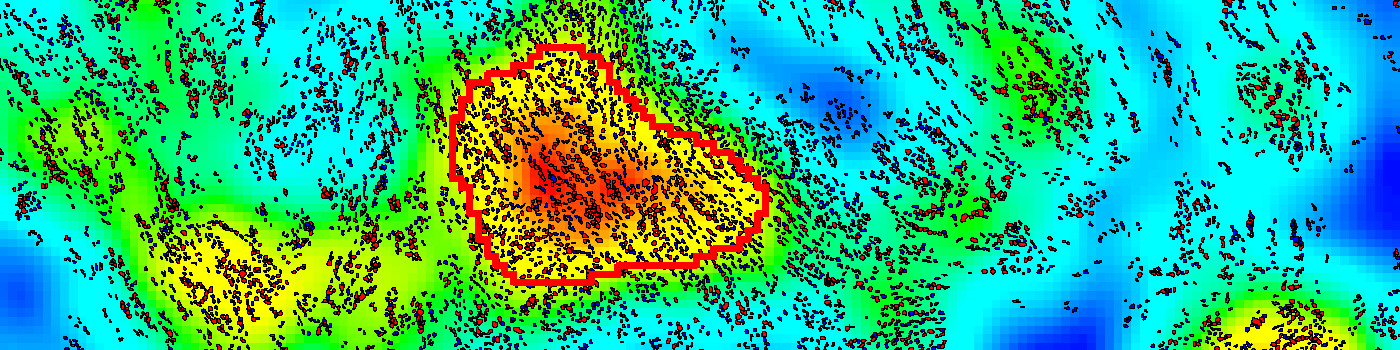
The results produced by the Hot Spot APP for the image in FIGURE 1. The user is presented with the created heatmap and the hot spot (red outline). In this case the hot spot was defined to follow the heatmap contours until the hot spot contained 200 nuclei. This definition can be changed for different use cases.
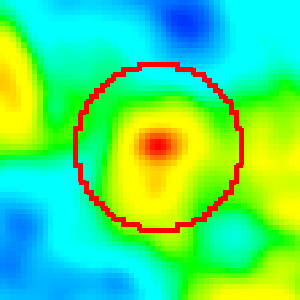
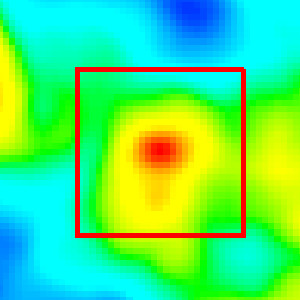
The hot spot shape is defined in one of four ways, here as a circle of a fixed size.
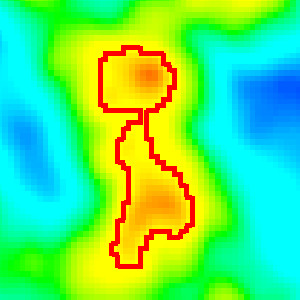
The hot spot shape is defined in one of four ways, here as a shape that follows the heatmap contours until a predefined number of nuclei are reached.
Quantitative Output variables
The output variables obtained from this APP include:
References
LITERATURE
1. Stålhammar, G. et. al. Digital image analysis of Ki67 in hot spots is superior to both manual Ki67 and mitotic counts in breast cancer, Histopathology 2017, 72 (6), 974-989, DOI.