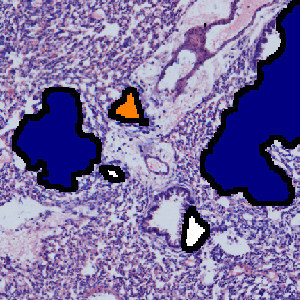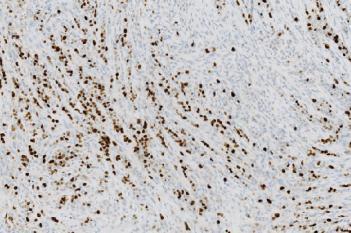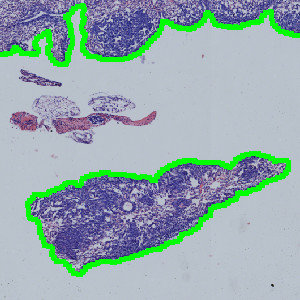
Result of analysis with APP: “01 Tissue Detect”. The lung tissue is automatically outlined.
#10118
Every year, more than 1.4 million women worldwide are diagnosed with breast cancer and over 450,000 women will lose their lives to this disease, mostly due to metastases to bones, lungs, liver or brain. By using genetically engineered mouse models of metastatic breast cancer (for example: MMTV-PyMT) or orthotopic transplantation of primary breast cancer cells, the effect of various treatment regimens (systemic therapy, targeted therapy) on pulmonary metastasis formation can be determined, see [1][2][3].
This protocol can be used to quantify metastases in H&E stained lung sections. The APP detects the total area of the lung tissue, delineates and separates the metastases and quantifies the area for each metastatic nodule. In the end, the total tissue area, the number of metastases, the area of each metastasis and the metastatic area percentage are given.
Result of analysis with APP: “01 Tissue Detect”. The lung tissue is automatically outlined.
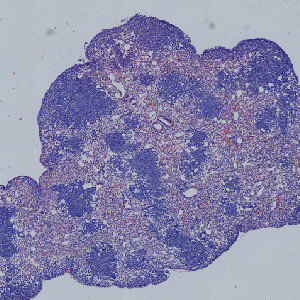
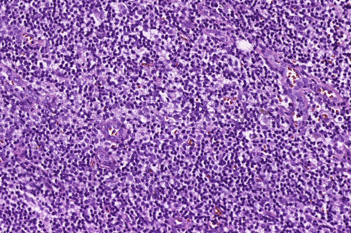
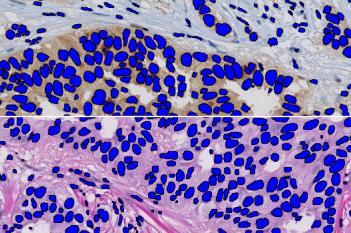
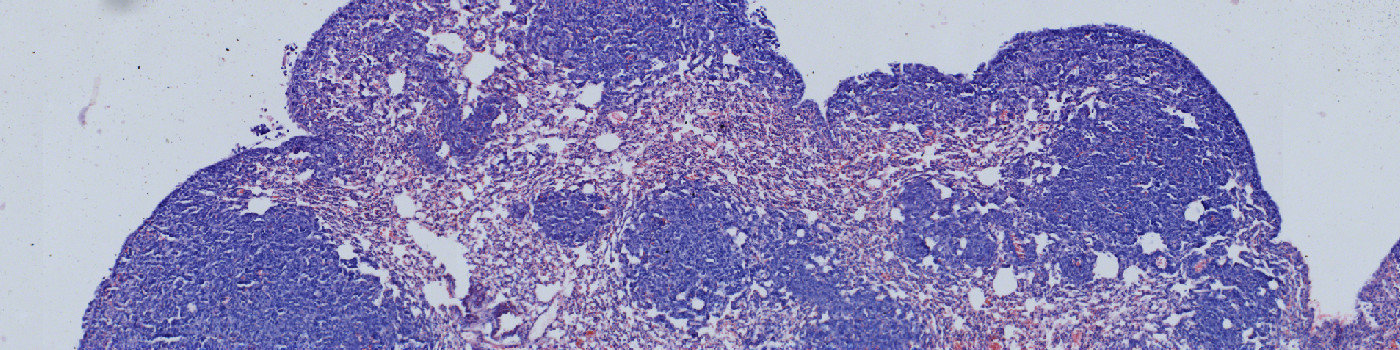
Close up of lung tissue.
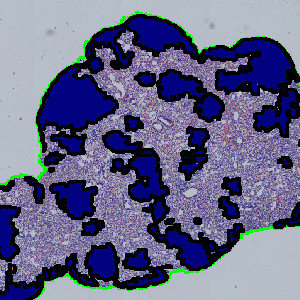
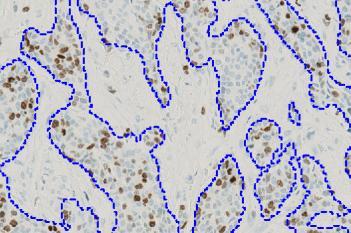
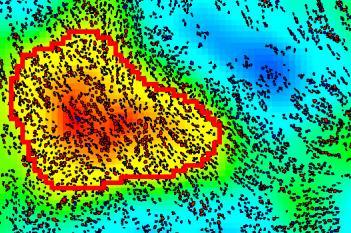
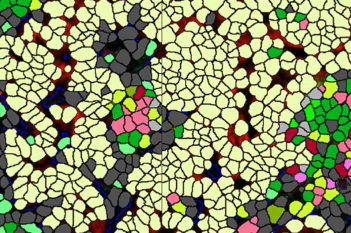
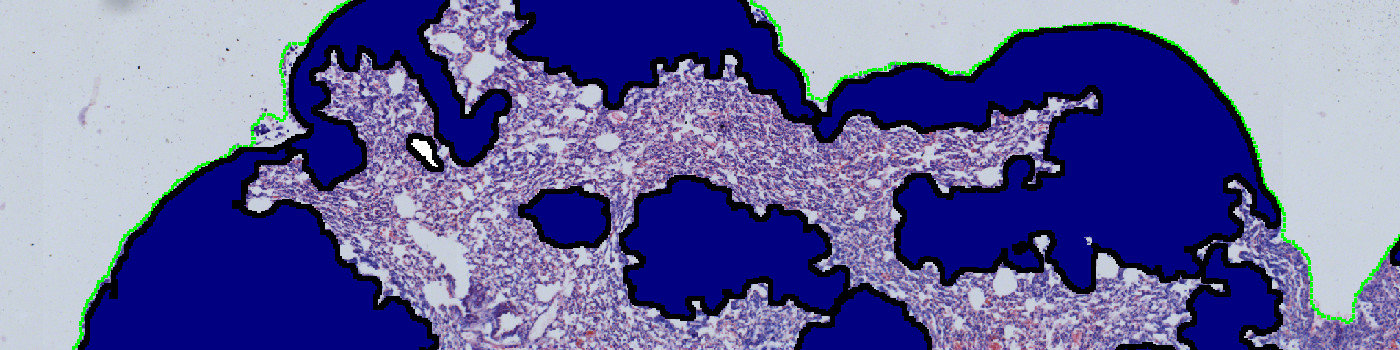
Result of the analysis showing the identified metastases (blue labels) inside the lung tissue.

Close up of lung tissue.
Auxiliary APPs
APP: “01 Tissue Detect”
This APP can be used for automatic and precise identification of tissue present on image.
Quantitative Output variables
The output variables obtained from this protocol include:
Workflow
Step 1: Load the APP for tissue detection “01 Tissue Detect” which outlines the lung tissue in the image.
Step 2: Load the APP for metastases detection “02 Metastasis Detect” which identifies the metastases inside the lung tissue.
Step 3: Load the quantification protocol “03 Analyze”. Click the save button to transfer the results to the database.
Methods
The first image processing step involves a segmentation of the lung tissue (see FIGURE 1). Afterwards the metastases are identified together with the regions that are either too misshaped, too red or too sparse for being identified as metastases (see FIGURE 5). The parameters defining the shape and sparseness of the metastases can easily be adjusted by the user.
Staining Protocol
There is no staining protocol available.
Keywords
Breast cancer, lung, metastasis, HE, H&E stained sections, quantitative digital pathology, image analysis, tumor progression
References
LITERATURE
1. Fantozzi, A., Christofori, G. Mouse models of breast cancer metastasis, Breast Cancer Res 2006, 8 (4), 212, DOI.
2. Saxena, M., Christofori, G. Rebuilding cancer metastasis in the mouse, Molecular Oncology 2013, 7 (2), 283-296, DOI.
3. Lin, E. Y., Jones, J. G., Li, P. et. al. Progression to Malignancy in the Polyoma Middle T Oncoprotein Mouse Breast Cancer Model Provides a Reliable Model for Human Diseases, American Journal of Pathology 2003, 163 (5), 2113-2126, DOI.