Transcript
Hello everybody. I’m Bettina Winkler from Visiopharm and I would like to welcome you all to today’s Research Rebellion webinar.
Today we have Viola Fan presenting her work as a research assistant in the department of sarcoma medical oncology at the University of Texas MD Anderson Cancer Center. Her work focuses on translational sarcoma research, spatial biology, multiplex imaging and computational analysis. She received her MS in Biostatistics from the University of North Carolina at Chapel Hill and will begin her PhD training now at the National University of Singapore.
She will walk us through a spatial proteomics workflow applied to a cohort of desmoplastic small round cell tumors which is a rare and aggressive sarcoma with limited therapeutic options and a highly structured tumor microenvironment.
COSMET COMET multiplex imaging was used to acquire the raw data and Visiopharm’s Phenoplex was used to establish the spatial framework of each sample. Viola will answer your questions after the talk so please add any questions to the chat.
We will start with a few poll questions before we dive in.
So the first one would be not sure if you can see it.
I guess, I think. What is your research area?
Okay.
The last is coming in.
Okay, so let’s take the next one.
And are you doing spatial analysis?
That was quick. Yes.
Good to see we have lots of spatial analysis pros here. That’s gonna be very interesting.
And so I’m looking forward to the next question. Do you have a multiplex instrument in house?
That’s an interesting setup.
And of course whatever images you use currently, are you using already Visopharm software?
Okay, fifty fifty.
Excellent.
So thank you very much for participating. And with that, I’ll hand over to Viola to start the presentation.
Thank you Bettina. Let me share my slides.
Okay I believe now you can see my slides.
Good morning, good afternoon, and good night everyone. Thank you for joining today.
I’m Viola from University of Texas MD Anderson Cancer Center. And I’d also like to thank the Visiopharm for inviting me to share my work. Today, I will talk about how we use multiplex imaging and spatial analysis to study desmoplastic small round cell tumor or BSRCT. I will focus on how we move from multiplex images to a single cell spatial dataset and what that reveal about tumor cell phenotypes and their relationship with their surrounding stroma.
For those who may not be familiar with DSRCT, it is a rare and a highly aggressive sarcoma that primarily affects adolescents and young adults with a strong male predominance. Treatment options remain very limited and a five year overall survival is only around twenty to thirty percent.
Molecularly, the SRCT is defined by the EWSR1WT1 gene fusion.
Recently, our molecular profiling study has identified its distinct tumor phenotypes, including populations associated with androgen receptor or AR expression, and the neuronal specific enolase, in short NSE expression. Histologically, as its name suggests, the SRCT is characterized by nests of tumor cells surrounded by dense desmoplastic stroma.
So for this study, there were really two questions we really want to answer. First, the distances between tumor cells, do they have difference? And how those tumor cells are organized related to their surrounding stroma. And that is where the spatial context becomes really important.
Additional non spatial profiling can tell us which markers are expressing and which cell populations are present in a sample or multiple samples. But when those signals are average and the mix across the tissue, we lose information about where those cells are located and how they are arranged related to one another. Spatial profiling keeps that information, which is very important. It allows us to look at marker expression and the cell abundance, while also preserving the location information and the tissue organization.
For DSRCT, this is particularly relevant because tumor cells are embedded within desmoplastic stroma and how these compartments are interacting is still poorly understood.
So spatial context give us an additional layer of information beyond the marker expression and the cell abundance alone.
With that in mind, we analyze the eight archival DSRCT specimens. Because DSRCT is an ultra rare sarcoma, each available tissue section is valuable. So we wanted to get as much information as we can from the material that we have in our hands. For each specimen, we select a nine by nine millimeter field of view for multiplex imaging using the LUNAR for CALMiD platform.
The HNI images here shows the representative regions that were selected.
Across the eight specimens, we profile more than one point five million cells for downstream spatial analysis. As shown on the right.
The number of cells varied across specimens reflecting differences in tissue size, quality, and their tumor stroma composition.
This cohort provide us the basis for multiplex imaging and the single cell spatial analysis.
Using the COMET platform, we designed and applied an eighteen plex antibody panel design to capture the major components of ESRCT microenvironment. The panel include tumor markers such as pan cytokeratin, antigen receptor, which is AR, neuro specific enolase, NSE, together with stromal markers, immunomarkers, and the vascular markers, also the proliferation markers. After imaging, we first review the individual marker channels, like the examples shown on the right, to make sure that the stain quality and stain patterns were reliable across one tissue or multiple tissues.
On the left is a representative whole slide multiplex staining image from sample T19, showing how these different signals are preserved together within one single slide, one image.
Once we were confident in the image stating quality, the next step was to turn these antibody signals into a structure analyzable spatial dataset for single cell analysis. We first use a trained tissue detection protocol in Visiopharm to separate tissue from non tissue regions and artifacts. We then train a second protocol, which is shown here, to classify the major tissue compartments, including tumors, stroma, vessels, and some remaining artifacts. For the single cell analysis, we also use Visiopharm’s existing cell segmentation protocol. The DAPI signal was used to identify individual nuclei and generate nuclear masks. And those masks was expanded outward to create a pseudo cell mask for marker quantification.
So this gave us both tissue level annotations and the single cell spatial information with together one more layer, the location of every single cell, which is analyzable and capture.
Here comes our result part.
With the single cell spatial dataset established, we next define the major cell phenotypes based on their marker expression profiles.
The heat map on the left summarizes the marker profile used for our cellular phenotyping. Within the tumor compartment, we identify several AR and NSE associated phenotypes, including AR high, AR low, NSE positive, NSE high, and hybrid, and the both low populations.
We also identified two major fibroblast populations, one enriched for only collagen and the other for alpha SMA and collagen. Together, we can also identify a few immune and also the endophenol populations based on their corresponding lineage markers.
Once these phenotypes were defined, we compare their abundance across the eight samples. As shown on the right, this bubble plot, the composition varied quite a bit from sample to sample. Some specimens were enriched in particular tumor phenotypes, while others maybe have larger, normal populations. And some sample might have some large amount of unclassified artifacts.
So even with this small, small cohort, we saw an inter sample heterogeneity in DSRCT.
Our next question was whether these differences were only in abundance or whether the tumor cell phenotypes, they also organize differently in space.
After defining those phenotypes, we now focus on spatial organization of these tumor populations. On the left, you can see the pattern of these tumor types differ across specimens. In each case, the dominant phenotype accounted for roughly thirty eight to seventy five percent of the tumor cells.
But the more interesting finding came from the spatial maps, which I show on the right. These phenotypes were not simply mixed together at random.
For example, in T15, we saw a large region dominated by AR NSC low tumor cells, while in the middle in the T19, AR high cells form compact tumor nests.
And on the right, the T14, the NSD positive region show a much more in the mix pattern with hybrid hybrid field types distributed within the same local area.
So these tumor cell phenotypes differ not only in their abundance and also in the way that they were organized locally within the tissue.
To quantify the patterns we saw on the previous one slide, we perform neighborhood enrichment analysis. So basically it compares how often a certain cell phenotypes are observed next to one another, with how much, how often those interactions were expected by random chance.
Overall, all tumor cell phenotype showed positive self enrichment, indicating that cells of the same phenotype tended to cluster locally rather than being randomly distributed.
The strengths of that clustering differ across the tumor phenotypes. For example, NSE high cells, it showed the strongest self enrichment, while the AR NSE hybrid cells were much, much more dispersed. We also included the endothelial cells as a spatial reference, because endothelial cells naturally, they organized into a vessel like structures.
So, which can provide us some useful benchmark, or what value that a highly structured spatial population will look like in this kind of analysis.
So overall, this analysis confirm that the tumor cell phenotypes are spatially organized, but they really differ in how tightly they cluster.
We spent a lot of time looking inside the tumor regions. So now finally, let’s step outside of the tumor region and look at their surrounding stroma environment.
The question here was whether those tumor cells phenotypes also occupy different positions related to their surrounding fibroblasts populations.
On the left is a simple schema of the analysis.
For each tumor cell, we measure the Euclidean distance to their nearest collagen enriched fibroblast or to their nearest alpha SMA enriched fibroblast.
We then summarize those measurements as cumulative distance curves, CDF, which are shown on the right.
The way to read this curve is very straightforward. So if a curve rises quickly at short distances, that tumor phenotype tends to sit closer to the fibroblast population.
And vice versa, if the curve rises more slowly, that means that that phenotype tends to be further away.
If we take a look at the collagen enriched fibroblasts, we saw clear differences between tumor phenotypes. AR low and the hybrid cells, they tend to be among more proximal populations, while NSC high cells, they were consistently among the most distal part. We also noticed an overall differences between two fibroblasts populations. For collagen enriched fibroblasts, most of the curves approach a plateau by around one hundred fifty microns. But in contrast, the alpha SMA fibroblasts, its curve extended over a broader spatial range, continuing to change even after the two fifty microns.
This suggests that these two fibroblasts populations, they are not distributed in exactly the same way around the tumor nest.
Collagen enriched fibroblasts appear to be positioned more intermediately or maybe right next to the tumor cells. But alpha SMA fibroblasts, they may distribute it across a broader stromal range.
So the main point from this analysis is that the tumor cell phenotypes, they were not positioned equivalently related to the surrounding stroma. They’re presumably dependent both on the tumor phenotype and on which fibroblast population we were looking at.
But there is an important limitation to using the Euclidean distance alone. What if one fibroblast population is simply just more abundant than the other? So the tumor cells will naturally tend to be closer to it by probability. So in this next step, we use a density corrected analysis to ask whether this relationship remain after we adjust for the cell density.
Here, we ask whether each tumor phenotype was observed more or less often than they’re expected at different distances from the fibroblasts.
On the heat map on the left, red indicates enrichment and the blue indicates depletion.
This heat map shows this spatial relationship were clearly phenotype specific.
The strongest pattern was seen also for the NSE cells. They were strongly depleted close to both collagen enriched and alpha SMA enriched fibroblasts. As the distance increased, that depletion gradually became weaker.
And this is consistent with NSE high cells occupying more stroma distal positions.
And if we take another look at the ARNSE lower cells, it shows almost the opposite pattern. They were relatively enriched close to collagen enriched fibroblasts. And they also show enrichment across the alpha SMA associated regions, especially at the intermediate distances.
And also the hybrid population, it looked quite different again. It stayed close to the neutral across most distance things, which suggests that these cells do not have a strong preference or avoidance for either fibroblast population.
We then want to know whether this cohort level pattern is also visible.
So we run the same analysis across the eight specimens, which the results show on the right.
This figure, it ranks the tumor phenotypes by their fibroblast distance percentile within their own sample. A value closer to zero means more proximal to the fibroblast.
And a value closer to one means more distal. Across these most specimens, ARNSE low and the AR low cells tend to occupied more proximal positions while NSE high cells were generally distal.
But T14 was the main exception. Interestingly, if you still recall, this is also the sample where the tumor phenotypes, they were more in the mix, in the tumor local spatial patterns that we recognized before in the previous slides.
They are not forming the tumor nest patterns which we saw in the other seven specimens.
Overall, these results show that the relationship between tumor cells and their surrounding stroma depends on tumor phenotype. And that patterns were largely reproducible across specimen.
Putting everything together, this study follows a fairly simple workflow. We started with archival FFPE, DSRCT tissue. We generate multiplex immunofluorescence imaging using COMET, and we perform single cell segmentation, phenotyping, and then use those results for spatially downstream analysis.
From that workflow, we could establish a consistent spatial framework. First, the AR and NSD defined tumor cell phenotypes. They show reproducible spatial organization rather than randomly spreading across the tissue.
And second, different tumor type, tumor phenotypes that occupy different positions related to the descoplastic stroma. AR high and the NSE high cells, they tend to be more stroma distal, while AR low and ARMSE low cells, they are generally more close to stroma.
However, the hybrid phenotype does not follow a simple spatial pattern. Instead it’s more dispersed, suggesting that that marker phenotype and the stromal proximity do not map onto a simple radical gradient.
So overall, this result points to distinct tumor stroma spatial niches within BSRCT. Importantly, this is still only a protein based study, only based on fixed two dimensional tissue slides. We can describe these spatial relationships, but we can’t tell the mechanism and the science behind it.
So, I will finish with three main take home messages. First, multiplex spatial proteomics allows us to profile DSRCT at single cell resolution across more than one point five million cells, while preserving the spatial location, the spatial information of the tissue. And second, the AR and NSE defined tumor cell phenotypes were not randomly distributed. They show reproducible patterns of spatial organization within the tumor and with their surrounding stroma. And the third, these tumor phenotypes, they still occupy different stroma contests, which points to candidate tumor stroma niches that maybe we can further explore in future functional studies.
More broadly, I think this study shows us how much biological information we can get from limited tissue when multiplex imaging is combined with computational visual analysis and spatial analysis.
And with that, I like to thank everyone who contributed to this work. And I want to give everyone one quick note before I finish.
This work we have been working on for a while, and it is currently being prepared as a manuscript. And we are working hard to post it on bioRxiv very soon. So if you are interested in the full analysis and more detailed results, please keep an eye on us. Thank you.
Thanks a lot.
That was very interest Eva, you have a and there’s the first one coming up. I was wondering how compatible this workflow with Martyomics.
Have you used the same tissue for spatial transcriptomics downstream?
Actually, our group has run the spatial transcriptomics, which is Visium. And we are still working on the following analysis, but so far we can see that the results we can merge them somehow for analysis.
That sounds good.
While we wait for more questions, I have one.
What was the most important image analysis step that you did for making the downstream spatial analysis reliable so that you really know the data is reliable?
Oh, it’s a really good question. So for me, I think the most important step using the analysis software is to training, to adapt it’s protocol and algorithm to our own images. So, because the tissues, they can look quite different across even eight images, they can have eight different features. So when we train the protocol in Visiopharm, we need to make sure to annotate a few representative region in each sample.
And then train them after a few iterations, we have to check the output. Because it’s not like a one time training. It has to be a iterative training to make sure that the quality of the segmentation is good. Because that one is really the basis of the following all analysis.
So basically, you keep monitoring the training while while it’s going. Okay? Yes. What is the limitation of the COMET instrument in your view?
I would say limitations in two ways. So first, it’s So this image we run it in for a long time ago, specifically like one years or two years ago, let’s say. So at that time, the maximum panel, like the maximum antibodies that we can design and put in the panel is twenty.
So basically we have to design a very, not say perfect, but really a complete panel to cover all the phenotypes we want to get. And that’s one limitation. And the other limitation would be, it’s also like a timely matter because I know that comment now they can be run together with RNAscope. So I would say our limitations for our analysis in this work would be it’s only based on the protein data.
So another question from me. What would be the next step to determine whether these facial relationships are biologically meaningful?
Okay, I will answer your question first.
Yep.
So I would say biologically meaningful.
Because now the work is only based on FFPE tissue. So what we can show is only what we observe or we can compute, but not really like the biological mechanism behind it. So the next step, we are going to design some functional models, and maybe deeper molecular profiling, just like spatial transcriptomics to further investigate what is the science principle happen behind this spatial patterns.
Okay, looking forward to that. A question from Lisa, what was the most surprising spatial finding from this study?
So firstly, think all the findings is really novel in this study, but personally I will say that it’s very exciting to see that they are two distinct tumor phenotype. They have completely different marker profile expression, but they can show similar spatial relationship to their surrounding fibroblasts, which is in our study, it’s AR high and NSE high. They’re completely different part of two different types of the SRCK, but they can show they are distal to the fibroblast.
Yep. Okay, nice.
So do we have any more questions? Not seeing anything right now. Doesn’t seem like it.
Okay, so if not then we can close for today.
Thank you very much Viola, that was very interesting and yeah looking forward to the next findings that you have and all the best for your adventure with a PhD!
And everybody else it would be great to see you next month for the next Wait, I saw one more question.
It’s from Jenny, right? It said, are all the analysis done with Visiopharm?
So yeah, I forgot to mention this. Basically all the analysis on the images, it’s down in the Visiopharm. But after that, we got the spatial data, which is x export it into Python for following analysis. But we do use Visiopharm Phenoplex to cross check with our Python analysis.
Do you use the interactive linking to cross check?
Yes. Yes. One is really interesting. Yes.
Okay, good to know.
Okay, so there’s no other question.
Then thank you again and hope to see everybody in one month for the next webinar.
Thank you.
Bye bye everybody. Jenny is asking which Python package?
Oh, Python package, it’s ScanPy and SqueePy. You can search them in the GitHub. Thank you.
If you have more questions, let us know. Just write an email and we’ll forward this. Okay. Bye bye, everybody.
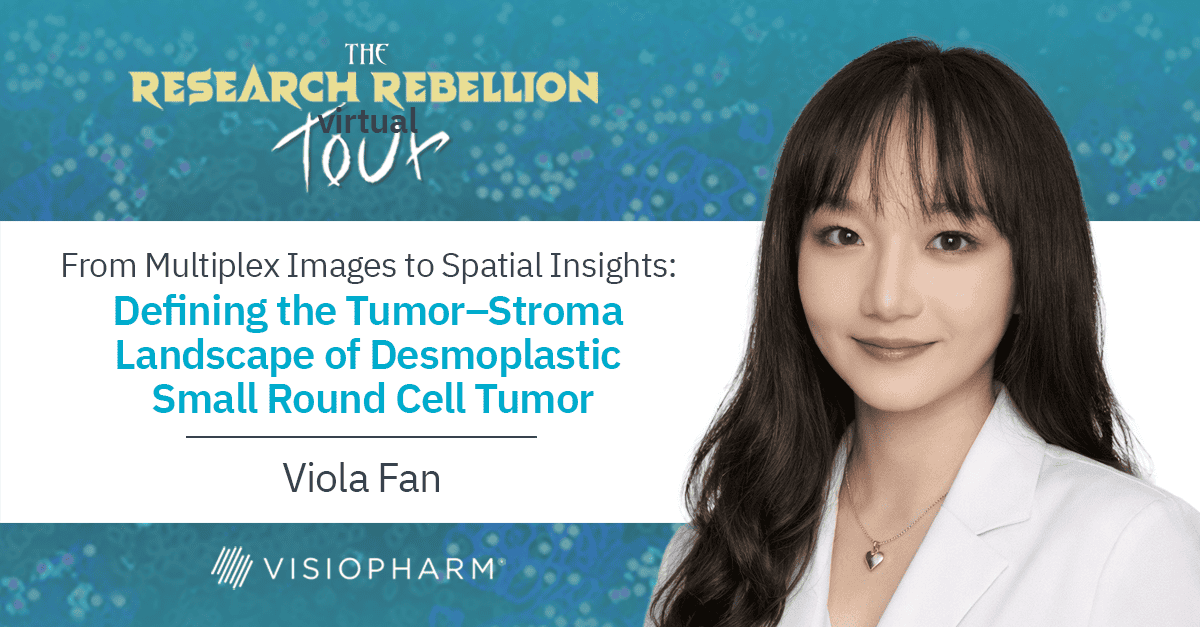
From multiplex images to spatial insights: Defining the tumor–stroma landscape of desmoplastic small round cell tumor
In this Research Rebellion webinar, Viola Fan from The University of Texas MD Anderson Cancer Center presents how tumor-stroma spatial analysis can reveal important biological insights in desmoplastic small round cell tumor (DSRCT). Using multiplex imaging, AI-driven image analysis, and spatial proteomics, she demonstrates how researchers can characterize tumor phenotypes, investigate tumor-stroma interactions, and uncover spatial patterns within the tumor microenvironment.
Focusing on desmoplastic small round cell tumor (DSRCT), a rare and highly aggressive sarcoma, Viola demonstrates how multiplex imaging, computational pathology, and spatial analysis can reveal the complex relationships between tumor cells and their surrounding stromal environment.
Using COMET multiplex imaging and Visiopharm’s Phenoplex™, the study analyzed more than 1.5 million cells across eight archival DSRCT specimens. By combining single-cell segmentation, phenotyping, neighborhood enrichment analysis, and proximity-based spatial measurements, the research team identified distinct tumor cell populations and mapped their spatial organization within the tissue microenvironment.
The webinar highlights how spatial proteomics preserves critical tissue context that is lost in traditional bulk analyses, enabling researchers to explore:
- Tumor-stroma spatial interactions at single-cell resolution
- Spatial organization of androgen receptor (AR) and NSE-defined tumor phenotypes
- Neighborhood enrichment and clustering analysis
- Fibroblast proximity and stromal niche characterization
- Multiplex imaging workflows for translational cancer research
- Computational pathology using Visiopharm Phenoplex
- Integration of spatial datasets with downstream bioinformatics analysis
The findings reveal that distinct tumor phenotypes occupy different stromal niches and exhibit reproducible spatial patterns across samples, providing new insights into the biology of DSRCT and demonstrating the power of multiplex imaging combined with spatial analysis.
Watch the webinar to learn how researchers can move from multiplex images to spatial insights and uncover biologically meaningful patterns within the tumor microenvironment.

Viola Fan
Viola Fan is a research assistant in the Department of Sarcoma Medical Oncology at The University of Texas MD Anderson Cancer Center. Her work focuses on translational sarcoma research, spatial biology, multiplex imaging, and computational analysis. Using high-plex spatial proteomic profiling, she studies tumor–stroma interactions and spatial organization in desmoplastic small round cell tumor (DSRCT) and other rare sarcomas. She received her M.S. in Biostatistics from the University of North Carolina at Chapel Hill and will begin her Ph.D. training at the National University of Singapore, continuing her work at the intersection of computational analysis, spatial biology, and cancer research.