Transcript
Good day to everyone joining us and welcome to today’s Xtalks webinar. Today’s talk is entitled how multispectral imaging enables analysis of macrophages in chronic liver disease. My name is Sonia Hunt and it’s my pleasure to be your Xtalks moderator for today.
Today’s webinar will run for approximately sixty minutes. This presentation includes a q and a session with our speaker. This webinar is designed to be interactive and webinars work best when you’re involved. So please feel free to submit questions and comments for our speaker throughout the presentation using the questions chat box, and we’ll try to attend to your questions during the q and a session.
Now this chat box is located in the control panel, and that’s found on the right hand side of your screen. If you require assistance, please contact me at any time by sending me a message using that chat panel. At this time, all participants are in listen only mode. Please note that this event will be recorded and made available to you for future streaming on x talks dot com.
At this point, I’d like to thank Visiopharm who developed the content for this presentation.
Visiopharm is a world leader in AI driven digital precision pathology software, leading biopharmaceutical companies, contract research organizations, CRO, academic medical centers, and diagnostic pathology labs all over the world uses Visiopharm’s technology for tissue based research and diagnostics.
Its solutions use the latest advancement in artificial intelligence and deep learning to make the most comprehensive, highly configurable, and accurate tissue mining tools available on the market today. Visiopharm was founded in two thousand and one and is privately owned. The company operates internationally with over nine hundred licensees in more than thirty eight countries. Company headquarters are in Denmark’s Medicom Valley with further offices in London, England, Munich, Germany, and when and Westminster and Colorado.
Now it’s my pleasure to introduce your speaker for today’s event, and that’s doctor Heather Stephenson Lerner.
Her clinical focus includes liver transplantation and gastrology pathology.
Doctor Stephenson’s completed a fellowship in the transplant pathology division at the University of Pittsburgh Medical Center. Doctor Stevenson leads UTMB’s liver diseases diagnostic management team, which is popular with hepatologists, transplant coordinators, fellows, and residents. She received a University of Texas Rising Stars award, is on the executive committee for medical school admissions, and received the best anatomic pathology faculty award from UTMB’s pathology residents and fellows for the year twenty sixteen, twenty seventeen academic year. Now it is my pleasure to pass over the controls to Heather. So, Heather, when you are ready, you may begin.
Good morning. I just wanna be sure that everyone can see my screen.
Yes. We can see your screen.
Great. Great. I just wanna thank everyone for joining us this morning, and thanks especially to Visiopharm for all of their help over the years with my research and for inviting me to give this presentation to you today. So we’ve already gone over the title of my talk. I’m gonna give you a little bit of background about liver disease this morning and a little bit of the history of how I got involved in this area. Research is very near and dear to my heart. I have a stepmother that, passed away a couple years ago from liver cancer.
And when my brother was born, he was, transmitted with hepatitis c virus maternally. It’s only about a four percent chance that you get this virus for, when you’re born and he he was unfortunate enough to get it. Well, now we have some good news because we have these new antivirals and he was treated and he’s essentially cured. So there’s, you know, a good side and bad side, but a positive outcome on that story.
But my heart is very much involved in this in this research. I’m gonna show you, why it’s so important and why this is a what I’m doing is a is an important area. I’m also gonna show you why this platform and also using Visiopharm’s wonderful algorithms and software has really facilitated the work that we are doing. For those of you who do not are not familiar with macrophages, these cells especially in the liver are very much embedded in the liver tissue almost like a fly paper.
The Kupffer cells that are the embryologically derived, the ones that are kind of always residing in the liver, they they don’t really move around much. They’re kind of stuck in there in this microenvironment.
And when they they’re really supposed to be a tolerogenic cell. If all of us had activated macrophages in our liver, we have everything that we eat, all of the antigens from the bacteria in our gut go to the liver every day. So if our liver overreacted to every single thing we saw, we would all have cirrhosis or scarring of our livers. So the cells in the microenvironment in the liver are extremely important and these macrophages if you pull them out of that microenvironment to try to study them for example with flow cytometry or in in vitro assays you’re going to completely change their phenotype and activation and they’re really not the same.
So we really believe, and and it is we are finding that it’s true that studying these cells in situ where they naturally reside inside the liver along with some of the other players in hepatic fibrosis are really the best way to know what these cells are really expressing in the human liver where they naturally reside. So I’m gonna go into, some background about liver disease and and talk a little bit about what I’ll be going over with going over today.
We’re gonna talk a little bit about you have to know a little bit about liver disease to understand why we’re doing what we’re doing in my lab and what we’re learning. Also need to understand a little bit about liver histology and that that is the normal what the normal liver tissue looks like under the microscope Because what we’re doing, this spectral imaging and physiotherm analysis actually preserves the hepatic architecture. And what I mean by that is if we were to take a single cell suspension for flow cytometry, all we all we end up with is a bunch of cells. We digest the collagen and so we can’t really tell is this macrophage in a portal tract, is it in a lobule, where where is this cell, who is it talking to, you know, that is very hard to determine when you disrupt the architecture.
So we’ll go over some normal liver histology, talk a little bit about our multiplex staining and how we developed the six color, multiplex immunofluorescence, panel that we’re using. We’ve developed several others, but I’m gonna be focusing on the main the first one we developed today. Gonna talk a little bit about some of the advantages and disadvantages that we’ve identified during our work. I’m also gonna, I already mentioned a little bit of this, of why it’s important to study these cells in their natural environments.
And I’m going to talk a little about some of the pathogenic and protective macrophage phenotypes. We’re really interested in studying why some people why can some people have the same exact disease, same sex, same age, same environmental risk factors and one person gets cirrhosis and their liver needs a liver transplant and the other person’s liver looks like a control liver with nothing in it? That’s really our question. And I really believe that you have to study the liver microenvironment to understand this because there are so many external factors.
I mean, there’s alcohol, there’s medications, there’s obesity, there’s toxin exposure, environmental exposure. I mean, there’s just too many things to try to determine this just based on risk factors, external risk risk factors. I truly believe that the answers are lying in the hepatic microenvironment and that is the focus of our studies.
So as I mentioned I’m gonna talk a little bit about liver disease and why it’s important.
So in the United States, and I’m talking in I mean this is worldwide, but even in the US, every single age group is having an increase in cirrhosis. And it you know, the liver is not like a kidney. You know, of course dialysis is not fun, but but if you get end stage kidney disease, at least you have a safety net. You can get dialysis.
We don’t have dialysis for our liver or our hearts, for example. If you have end stage liver disease and you’re decompensated, your only hope is a transplant or or you unfortunately will it is a fatal disease. And it’s not fun either. A lot of these liver diseases don’t show any signs or symptoms until they’re very advanced and these people have these big old bellies full of ascites and tons of complications, jaundice and all of that.
And what I would like to point point out to you is in my age group here, is this very much, increasing and this is thought to be because of obesity and increased alcohol use in women. And I’m sure that many of you have seen on social media seems like COVID has increased the alcohol use a lot in people because they’re sitting at home bored. So I really think that these numbers are even gonna be worse, unfortunately.
This is the graph showing the increase in liver cancer. You know, we’re getting a lot better at diagnosing lots of cancers earlier on and, decreasing their incidence, but not the case with liver cancer. Hepatocellular carcinoma is the main type of liver cancer. And no matter what type of liver disease you have, the more scarring and the more fibrosis that you have in your liver, the increased risk you have for liver cancer. So in other words, you know, we don’t wanna get cirrhosis because we don’t want a transplant, but we also don’t want a lot of fibrosis in our liver because that also increases our risk of developing hepatocellular carcinoma.
Now if we have an early, liver cancer, a small one, you can’t get that either resected or there are some treatments for that. Your breast treatment for early HCC or hepatocellular carcinoma is a transplant again. And as we all know, you know, there’s limited number of donors donor livers in the world, so patients stay on the waiting list every day. That’s a big problem.
In Texas, we have a very higher rate of liver cancer. The dark blue states are the ones in the United States that have the highest incidence, and we are one of those, unfortunately.
We have a lot of, Hispanic population with diabetes. We have a lot of obesity. People like their barbecue.
Everything’s bigger in Texas. I’m sure you’ve heard that.
So we we do have a large number of, liver cancer here as well. So it’s a very important problem worldwide and locally here where I live.
So there are many causes of liver disease.
We all know about viral infections such as hepatitis c virus which my brother had and has been cured. There’s hepatitis b which is the most common worldwide. I already mentioned to you alcohol, obesity, and there’s some lesser known ones, autoimmune disease, autoimmune hepatitis for example, hereditary causes like iron overload, hemochromatosis, and things like that. But really, a lot of times, there’s people that have multiple risk factors. So if you have a little bit of a genetic component towards hepatic fibrosis and then you maybe get a viral infection or drink some alcohol and you’re overweight, so the more of these hits that you have, the more your risk is to go down this path, and you don’t wanna go down this path. We all wanna keep our livers happy and in this normal liver tolerogenic, you know, not fibrotic state, pro fibrotic state.
So once we go down this path, we, you know, we get several years of inflammation. Very often in hepatitis C, for example, this takes twenty to thirty years. And even some people will never go to the cirrhosis phase. They say really about twenty percent of people will get cirrhosis and of those twenty percent an even smaller amount will get end stage liver disease or HCC. But these are the outcomes that we really wanna prevent and are the main goal of my research.
So right now at standard of care, we order liver biopsies and I’m a pathologist, a specialty trained hepatopathologist. So I I see these livers every day. And really what we do is we give the clinician a diagnosis. Well, you know, this yes.
This This is consistent with autoimmune hepatitis. We match that a lot with the labs or viral hepatitis. But one of the most important things we do is we give them the fibrosis stage. And that just means how much fibrosis or scarring is in that liver because for chronic liver disease, that’s the most important prognostic factor.
As I just alluded to, cirrhosis, you if if you get end stage cirrhosis, you need a transplant. If you get cancer, that’s a bad outcome. You also need a transplant. And sometimes we discover these cancers too late when we really can’t do anything, unfortunately.
So my whole point is, you know, we’re already taking this liver tissue. I only use about half of it to make my diagnosis and my reports every single day. Why don’t we do something cool? And, you know, this patient just went through an invasive procedure.
We took a piece of their liver. I mean, it’s not without side effects or complications. Why don’t I give them more information out of this precious human liver tissue? And there’s so much more we can do, and that’s one thing that spectral imaging and the and Visiopharm is able to do.
We are able to get all of this information and data from formalin fixed paraffin embedded tissue. And here at UTMB, I fought for this. We have we we save all of our tissues. We actually have, over over thirty years of FFPE tissue blocks here and these are the type of tissue that are used for this work, which is amazing.
And if you think about this, it’s actually, you know, of course, we wanna do prospective clinical studies as well and that’s what we’re working towards. But if we think about it, when you’re trying to generate preliminary data for grants and things, you know, we have I can go back to deliver biopsy from twenty, thirty years ago and now I have the clinical outcome to go with that. Did they develop cancer? Did they get cirrhosis?
Did they get a transplant? So I have the follow-up data to go with the tissue. And so it’s really a gold mine, and so I think everyone needs to kind of think about that. And these platforms are great for this type of work.
So now I’m showing you, the difference between two liver biopsies. This is just a representative example with somebody with viral hepatitis C and in the top I am showing you, again, as I mentioned, these are two female patients, very similar demographics, similar risk factors reporting similar alcohol use, very, very similar. Twenty years, is with their estimation of having this virus. This liver on top looks just like a normal control liver, very little inflammation.
What I’m showing you here that this is a portal track in the liver. It’s where the blood vessels run through, the bile ducts where our bile drains from the liver. These other smaller vessels are central veins. But you’ll notice this patient has a little bit of inflammation in their liver.
And this blue here, this is a Mason’s trichome. This is showing you collagen. This is a normal amount of collagen in the liver. It runs through with the portal check.
So this is a normal amount. Basically, this patient has been walking around with a virus for twenty years and their liver looks like a control liver. As a matter of fact, I hope my liver looks this good. I mean, there’s a little bit of inflammation here.
I mean, which some people will have just from medications and otherwise, but this liver is in pretty darn good shape for having a virus for twenty years. In contrast, the one on the bottom, you’ll notice all this blue. This is what we call bridging fibrosis and nodule formation. So this is cirrhosis.
So now we’re starting to get where we have these big bands of fibrosis in the liver. And if this patient keeps moving this direction, they’re gonna need a transplant.
So what in the heck is different here? We all want our liver to be like this. We don’t wanna go down this pathway. So what we’re really trying to do is understand the differences in these livers. We’re looking at these patients’ livers early on in the disease course to see if we can predict which path they were gonna go down before they go down it.
And so the way that we’ve taken this beyond just a pathology report is using, the we have a Vectra three in my lab. There’s also a Polaris. I do work with MD Anderson as well, and the Polaris is a little bit more high throughput.
There’s also a two hundred slide Vectra but we just have a six slide Vectra three in our lab but we’re the only ones using it so it actually works out great for us.
Some of the things I just wanted to touch on really quick that we’ve discovered since we’ve been using this now for the last three or four years, there are a lot I I would say most definitely the advantages outweigh the disadvantages.
But it allows for quantification of multiple antigens in the same cell or cellular compartment. So we’re looking at macrophages and oftentimes these are all membranous or cytoplasmic markers. We have a a couple nuclear markers.
If you’re able to develop a spectral library, this allows you to eliminate spectral overlap.
You can, basically take away the inherent autofluorescence by using a control and stain slide that’s treated the same way. So liver has a ton of autofluorescence because it has a lot of lipid, and it’s very, very autofluorescence. So this is very important to subtract this. It can use TSA amplification and I already mentioned this. Some of the disadvantages is, you know, to get this going, initially can be a little bit costly and time consuming. I highly recommend having a pathologist expertise to determine what stains and antibodies are good and if the staining pattern is accurate and before you move forward.
It’s also, important to make sure that you have very consistent specimen collection, fixation, and sectioning. For example, if you cut a liver biopsy at six microns and then at three microns and try to compare the data, that’s gonna be challenging. We cut all of ours at three microns because that allows less overlap when you’re you’re looking at high cellular concentrations.
So all of our liver biopsies are always cut the same thickness processed in the same lab in a very similar manner.
And the other problem which Visiopharm has really, really helped us to resolve, has been a game changer for us is the large volumes of data generated. I’m gonna show you today how Visiopharm is able to take a lot of data. I mean, we’re talking multiple images per patient with multiple patients per group with five to six markers per biopsy. And imagine that if if you look at the Excel files, that you generate from this work, it’s over a thousand pages of Excel data per patient, and we’re looking at multiple patients per group.
So it’s quite mind boggling, from my PhD work when I was using, you know, five mice per group with the, you know, the little flow cytometry. You can you can have a lot of data, but nothing like this. I mean, you even have x and y coordinates. I mean, it’s it’s really I really didn’t realize that I needed so much experience in bioinformatics to understand all the data we were generating.
So so again, you know, Visiopharm has really helped us in this in this area.
So now we’re gonna go a little bit into the research and some of my results and and why we’re doing what we’re doing. So macrophages, as I already mentioned to you, these, cells are extremely important in the liver. And I mentioned to you there were some that are the embryologically derived. Those are our Cooper cells.
Okay? And then inside the liver, you also have this endothelium. So So this is called the liver sinusoidal endothelium. It’s very, very specialized endothelial cells which lets, has fenestrations, letting certain things pass and other things are not able to pass under normal conditions.
However, if we break this, quiescent or tolerogenic barrier and activate these Cooper cells and these endothelial cells, they end up recruiting monocyte derived or bone marrow derived macrophages or monocytes from other sites.
And these guys come in and are able to transmigrate, into the tissue and activate a lot of the cells that are very important in producing the collagen. So once this pro fibrotic or pro inflammatory pathway is activated it’s very hard to go back the other direction. So once this is breached we activate a lot of downstream players, we cause liver injury, and we start laying down collagen and causing scar formation.
There’s also some very important pathways here. Chemokines are known to be involved in recruiting these cells and there’s some very important chemokine inhibitors now that are out there that have been shown to decrease fibrosis in the liver.
So if you wanna learn more about what I’m about to present to you today, we had a recent publication that came out in Hepatology Communications that talks about all of our optimization of these protocols, our, Visiopharm, algorithms and and data analysis, the type of files we send. It has a lot of technical information about how how we optimized, this panel and the imaging analysis. So if you want more details of anything I’m about to show you, please feel free to take a look at our recent paper.
And also, Ben Freiberg is from Visiopharm and he’s also a co author on this paper, and also our collaborators at MD Anderson as well, particularly Dr Laura Barreta.
So this is just to show you, I’m not gonna go into a ton of details about I have a lot of data to show you about how we optimize this. If anyone has any questions, I’m happy to discuss this. But in a nutshell, the way that we start off with our antibodies is if, you know, if you have just a normal good chromogenic, IHC stain that you’re happy with, that’s a great place to start.
Just making sure I don’t have any any questions here, going so far.
I think we’re good for now.
But if you have any questions as I’m going through the data and want me to explain anything further further, please feel free to add a a question in the chat box. But, basically, if you have a nice chromogenic IHC stain that you’re happy with it and it’s nice and clean and it’s working well for you, that’s a great place to start. So we already had we already liked our CD68 or 163. And then I was told about this great stain, MAC387. This is the one that marks those monocyte derived macrophages that come from the bone marrow. And I’m sure those of you that study macrophages are very familiar with the CD14 and sixteen.
These, whether they’re high or low, are very important in pro inflammatory and anti inflammatory macrophages, but this is most commonly done in flow cytometry. So a lot of people have been really excited that we’ve been able to get these markers to work in tissue.
It’s not very easy to do, but, with the Vectra and Visiopharm, we’ve been able to do that successfully. And I’m gonna show you some really beautiful data showing the differences in those markers in a moment. So we then the next thing is once you’re happy with that, then we start off with our primary antibody dilution first. You do sometimes you will have to mess around a little bit with the order, the order that these go.
You know, of course, each of these are gonna be undergoing if it’s the first antibody, it’s gonna undergo a lot of antigen retrievals unlike the last antibody, which only undergoes one. So that position is very important as far as unmasking your antigens. Remember that these are cross linked because they’re formal and fixed, so that’s an important thing to think about. Once we’re happy with our primary dilution, we move on to the opal dilution and we we mess around with that a little bit until we get our MSIs in the right, in the in the right region, which is roughly fifty to one hundred on the on the Vectro when we’re looking at our initial monoplex slides.
When I say monoplex, we we start off staining each of these antibodies by themselves.
So controls are crucial. One, because you can see the, you know, the how the antibody actually looks. But the other thing is that they’re required to make our spectral library, which I told you about.
Also we use one unstained slide and that’s the slide that allows us to subtract that auto fluorescence which is important as well. We do mess around with the buffers a little bit but in this panel we only had to change one of them to the AR nine buffer. And all of these details again are in the paper.
Once you’re happy with your monoplex stains then we move on to the multiplex stain.
So this is that spectral library, that I wanted to show you.
So again, you you basically recording all of the emission spectra from your monoplex stains. So each one of these lines, is one is one of our markers and the different opal fluorophore.
And then we also have the the black line which isn’t labeled here is an unstained, the unstained slide. So that’s the autofluorescence.
So your spectral library remembers all of this. So then when I do my multiplex stain, it’s able to subtract the other emission spectra from the from the other channels and that gives you a nice clean signal on each of your, fluorophores of interest.
So that’s why we’re able to do some of these. We’re able to subtract out all of this spectral overlap, which is extremely important. So here’s an example just showing our monoplexes for CD68, CD14, CD16, CD163, and then MACRA-87 is a nice clean stain. Again, that’s the one I told you that I highlights those monocyte derived MACs.
The nice thing is we can also get an IHC view if you’re more used to looking at that. That’s part of the Visiopharm software on the Vectra.
We also know that these macrophages form these huge clusters in fatty liver disease and autoimmune hepatitis, and we found that those had a lot of CD163 positivity here, which is known to be a pro fibrotic macrophage. And one other quick thing I wanted to mention is the m one, m two, I’m sure a lot of you that work with macrophages hear m one and m two all the time, pro inflammatory and anti inflammatory, but it or it is way, way, way too simplistic, and I’m gonna show you why in a second.
This is just showing the controls to show you the difference. This is a very active liver with a lot of inflammation and very much pro fibrotic compared to a control liver which is very quiet. Look how much fewer these monocyte derived macrophages are there. CD14 is a protective marker on the liver endothelium that’s why it’s in both the control and the disease state.
So what we wanted to do next and we’re gonna be talking about, Visiopharm here because they helped us look at the different patterns in these different diseases. So what we really wanted to do is, okay, now we have our mono our our, multiplex panel working great. We started off with a disease where we had a ton of tissue to work with and we could burn through a ton of unstained slides for the staining and that was viral hepatitis c. So once we had everything optimized in our HCV cohort, then we added in other diseases.
Okay. Well, we have this working with HCV. Now will it work with fatty liver disease, which is a huge problem in our country, autoimmune hepatitis shown here on the bottom right, what will it work with those? And honestly, we didn’t change really anything at all.
We just cut our slides at the same thickness and processed them in a similar fashion and we were able to stain all of these different diseases without tweaking our protocol at all. So So that was something that we were really excited about. And so then we took the multi component TIF files and we sent them to doctor Freiberg at Visiopharm and he helped us. You know, this is beautiful.
I I can tell just by looking at this, this control has a lot less staining in it. This autoimmune hepatitis is like wow. I mean we can tell there’s a ton of staining, a ton of cells here.
We can tell that fatty liver disease had a lot of those monocyte derived macrophages. You know, we can also tell which compartments these are in. We see these are in the portal tracks so we can do the tissue segmentation. But really, you know, it’s really hard to get a whole lot out of this just very qualitative data.
And so when we go to VisioPharm, they’re able to take these multi component TIFFs and actually identify what phenotype and where these macrophages are lying in the hepatic parenchyma. So this is this is just, I mean, amazing to me when I first received these data. And there are a couple conclusions that we made from this that our initial analysis was one, you can see that a tolerogenic liver, this is a control patient without any known liver disease, normal liver enzymes. You know, I get the liver biopsy and I’m like, why did they do this?
You know, maybe they had a little blip in their enzymes a few weeks ago, but now their liver’s quiet.
So in a control liver, these macrophage phenotypes are very, very tightly clustered.
These are tisme analysis. It’s a it’s a dimensional reduction to look at similarities among different phenotypes of cells. And we can see that, you know, these are all of the ones that didn’t stain with any of our markers but these very nice tightly knit clusters here in a control patient. However, when you introduce any disease in the liver, I don’t care if it’s hepatitis c, a fatty liver disease, or autoimmune hepatitis, you really increase that diversity and complexity of these cells.
These cells start to become dissimilar. You get a lot more complexity. And and when we look, HCV does kinda dampen the immune system a little bit. That’s why the virus is allowed to persist.
So this pattern is a little bit unique. It has some of these similar kind of tolerogenic cells here. But what you’ll notice over here in these two types of liver disease where we know macrophages play huge roles and and NASH in particular, it’s they’re one of the main meteor mediators of scarring in the liver. We have some very prominent clusters.
We have this very, you know, this dark green or kind of fluorescent green. Look at these autoimmune. It has this big population of orange and kind of this hot pink or magenta. And this is wonderful, but, like, what the heck are these?
Right? And this is where Visiopharm comes in. So this is the phenotypic matrix algorithm. And so it’s actually able to take each one of these different phenotypes that we identified and and tell us what they are.
And this is this is really cool. I mean, now we’re starting to look at different markers that we might potentially be able to inhibit with fibrosis, fibrosis inhibitors. So if we look at these two clusters here that we found in fatty liver disease, we’ll see that there’s a lot of CD68s and a lot of these CD163s, which I already showed you on the immunofluorescence. So there was a lot of 163s.
So you really can kind of back check your data. Right? I I mentioned to you before that there there was a lot of CD163 and again we’re seeing that here. So it correlates extremely well.
And we also have done NanoString molecular work in the same markers that we’re finding increased with our spectral imaging. We’re also finding increased, the genes are increased as well. So everything is going together very well. All of our data has has been very reproducible and matching what we would expect and what’s what’s actually been published in the literature, and we’re even kind of second, you know, checking ourselves.
Everything is is really coming together nicely. And if we look here in the autoimmune group, this, orange group here, is this another CD163. So in in this graph that I should mention this quickly, is that the darker the green, the more expression of that marker you have. So you can see that in autoimmune hepatitis, there’s a there’s a primarily this fourteen CD163 and fourteen, CD68 fourteen 163 here.
In contrast, when we look at NASH, we have a lot of the CD163 alone, some of the 68-163.
So this 163 phenotype looks like it definitely is an issue with people who are starting to go down the path of fibrosis.
Also wanted to point out the CD14 here. This is known to be a tolerogenic marker expressed by liver sinusoidal endothelial cells and is also expressed on macrophages.
But what we found is that the control livers have a lot of CD14 and you start to lose this when you go down that pro fibrotic pathway. And interestingly, as I mentioned to you, hepatitis c tries to keep your liver a little more tolerogenic as well and to to keep replicating in the liver. And interestingly, you’ll notice more tolerogenicity in those livers. So everything that we have so far on these data correlate very nicely with the published literature and what we would expect.
So then we wanted to move on and, you know, we wanted to look at more patients per group and more, more regions of interest, basically. We wanna look be able to do a more high throughput with a higher volume of patients. And so that’s where batch analysis comes in. So now we take this is a a liver biopsy on low power and we’re taking these little each box is called an ROI or region of interest. So we’re taking multiple ROIs per patient and we try to take these, at least fifty percent of the liver biopsy tissue of these boxes. This is just a blow up of that and then this is a blow up of one of these boxes.
And so what we did is we took two different disease types, fatty liver disease and viral hepatitis C and we took, six patients with cirrhosis. I forget the exact end. It’s six and five per group as well as controls. So So we took cirrhosis patients with cirrhosis or end stage liver disease and patients with those tolerogenic or very minimal fibrosis and we compared those together. And we found that this this yeah. You end up getting like fifty to seventy images per patient biopsy, and then you can imagine with all these patients per group how many images and ROIs you get per patient. So we did batch analysis.
And then for the the I mentioned you, we did viral hepatitis, and we also did fatty liver disease. And this is another, area where Visiopharm can help you which is really cool. I don’t know if any of you out there read donor liver biopsies before transplantation, but if you do, you know that we look for the amount of fat in the liver. All of these little holes in the liver are fat droplets and using Visiopharm’s algorithms, we’re able to quantify this.
So right now, you know what a pathologist says when they get this? They look at this. Oh, this is about thirty percent macrovesicular steatosis. But they’re just estimating it in the microscope.
Sky. In a moment, I’m gonna show you it. So here is minimal fibrosis.
This is two patients with fatty liver disease. Somebody who has no scarring, just a little bit of that collagen and where that should be. And look at this patient this whole liver is almost blue so this patient has cirrhosis so this is just a representative of each of those groups I just mentioned.
So this is what Visiopharm can do so they can actually quantify they use the algorithms to help you actually quantify the amount of fat and they can give you an actual percentage of these fat droplets. And I wanna point out how what a great job it is done because it outlines the liver tissue and it actually is able to get rid of some of these artifacts, doesn’t count the vessels. It’s able to cut out the portal or central vein and portal veins here. Even these these cracks that you see that sometimes happen with, you know, processing the tissue and was able to very accurately, determine both macro and microvesicular, steatosis.
So this is just showing you the data. This is also from, Visiopharm taking these patients with cirrhosis and comparing them to the patients with minimal fibrosis to identify the pathogenic macrophage phenotypes that were present in these livers. So shown on the left, is showing you and I’m sorry my little, statistical significance, bars or asterisks disappeared on this slide. But all of the ones that are over about six fold here, or five fold, six fold were significant. So I have some really important pathogenic phenotypes. Again, that CD163 monocyte derived phenotype here is very important in fatty liver disease.
Increased macrophages overall as well. And and again, we took these and tried to determine all of the different phenotypes that were present. And what we found and actually can calculate the numbers of each phenotype present. So in the minimal fibrosis group, we did have some of the same phenotypes but just not to the number, or the amount that we saw in the patients with cirrhosis.
And again, that CD fourteen, is much more common. This is a completely separate experiment. That CD fourteen is much more expressed in controls or tolerogenic livers than the ones with cirrhosis.
So very, very powerful way to take a lot of complex data and an overwhelming volume of data and make it very simple and easy to, easy to review and understand.
So we did the same thing. This is just that same representative example from that viral hepatitis c I showed you a while ago. We did the same thing with HCV, and did tSNE analysis, and looked for these different phenotypes and we were able to identify significantly, increased populations in our controls, here which is again I mentioned to you that CD14 is very important for tolerogenic livers and then these three phenotypes were the ones that were the bad guys and increased in cirrhosis due to viral hepatitis C. Again that 163 CD68 and then those monocyte derived macrophages. So even though we’re looking at very different diseases here we’re seeing very similar trends of who the bad guys are, in these different disease types.
So I think I’ve shown you now how powerful this can be. I’m going in, I’m also working on taking half of the tissue. So I take three or so unsane slides to do my macrophage panels. I have this one I’ve shown you today and two other ones that we’ve developed.
And then I’m also taking the other half and doing NanoString to look at gene expression in the same liver biopsy of these patients. But today I’m just focusing on the spectral image imaging aspect. And so this is kind of where we’re going with this and we really hope to eventually be able to bring these platforms and software to the clinical arena.
So we have a patient diagnosed with liver disease, and the clinician orders a liver biopsy to help them confirm the diagnosis and also to help with that fibrosis stage.
The biopsy is collected and sent to pathology. So, again, you know, these biopsies are collected every day as standard of care in these patients.
And instead of just taking that tissue, making a diagnosis, and putting the rest in storage and forgetting about it, why don’t we do some more and get this patient some more valuable information out of this precious tissue? That’s where the spectral imaging and physiotherm analysis comes in. We have a patient that has a really inflamed liver. Hey.
Maybe you need to come back and see us. Your liver is not going down the right path path here. We might need to do something. You need increased surveillance.
Maybe some of these increased therapies that are under development might help you. And this patient, hey, your liver is really quiet. It’s like a control over. We’ll see you in ten years.
You’re doing great. You know, this patient, no alcohol, no hepatotoxic medications.
You know, so hopefully we can use this for kind of a personalization approach or precision medicine approach in the future.
And so I think that this is, really where medicine is going and and these platforms are gonna be be there with us to to, open up the field, for us to bring these to the clinical arena.
So in conclusion, this platform that I discussed today is optimized for staining of FFP or formalin fixed tissues which I think is extremely important because we have lots of these. We have a plethora, I mean, a whole warehouse full of these blocks and, there’s a lot of things we can do.
This multiplex staining followed by Vectra requires very minimal tissue. The entire panel and data that I showed you was from one unstained slide per patient. I’m able to get, if I cut it carefully at three microns from a, you know, a very well trained histotech, able to get between fifteen and twenty unstained slides per tissue block. And I showed you all of the all of the data in those patients with one unstained slide. So I can use the rest of that tissue for other panels, for molecular work or whatever. So I I think that’s extremely powerful.
Once it’s optimized, it may become more high throughput. And once your algorithms are developed by Visiopharm as well, things move a lot faster. You know, the first experiment took us a little time to tweak it, but once we have them developed and I’m I’m working on the same type of tissue and the same processing, it it moves a lot faster.
This is also, allows us to study these cells, and and other finicky cells like dendritic cells and hepatic stellate cells, all of these cells that are very, that change when manipulated or pulled out of the tissue. So this platform is ideal for that.
And again, I hope I’ve convinced you today that these macrophage phenotypes are numerous and complex. I mean, I was just using five macrophage markers and you see the amount of phenotypes I identified.
So again, you know, I’d like to just stress all of these advantages of this platform and and how I really truly believe that this is the optimal way to study the hepatic microenvironment.
I have a lot of people to thank for the work that I presented you to you today. I’ve been very fortunate to have a lot of grant grant funding and an excellent research scientist, doctor Saldarriaga, and doctor Freyberg and the and the whole team, at Visiopharm have been there for me through every step of the way and have always helped, with troubleshooting and, assay development and algorithms. So I I really appreciate their help. I also work very closely, as I mentioned, with MD Anderson, and Jared Birx has helped us a lot with our initial, technical aspects of the multiplex assay and imaging analysis.
And so, that concludes the end of my talk, and I’d be happy to open it up for any questions. Thank you very much.
Well, thank you very much, Heather. That was a very insightful and passionate presentation. I hope everyone enjoyed it. And now we’re going to start our q and a portion of the webinar.
And I have received a some questions have come in from the audience, so I thank the audience members for sending that in. And for those of you who have questions, please go ahead and use the chat box and send your questions through. So let’s start off with the questions I have already. So, Heather, are you ready?
Yes.
Okay. And we have Dan here, I believe, that’s gonna be helping out.
Yes. I’m here.
Okay. Hi, Dan. Dan, do you wanna introduce yourself to everyone so they know who you are?
Sure. I’m Dan Wankowski. I’m a technical sales specialist for Visiopharm on the, eastern half of the US.
Okay. Perfect. Alright. So let’s start off with our first question here. This question is, could you please explain how you choose your primary antibodies and the order of the antibodies for your multiplex panel?
Yes. So that, as I mentioned, I when I touched on that slide a little bit, we kinda go into more detail in that in on our paper as well. But we actually work with the chromogenic assays first, determine which ones that we are comfortable with. We do a regular IHC stain first, and then we move on to a monoplex immunofluorescent stain.
Once we’re happy with the immunofluorescent stain and the signals are not you know, one’s not too, too much too much more intense than the other, we we move on to the, multiplex staining. So first, it’s primary antibody optimization with different titrations and then opal titrations, and then we move on, make then we move them on to the multiplex and make sure that there’s not a lot of bleed over between the different signals.
And then once we get to that multiplex, then we’re ready to move on to the experiment.
Okay. Perfect. Alright. Here’s the next question I have for you. How do you store your tissue blocks or unstained slides prior to staining them for your spectral imaging studies?
So that’s a really important point that everyone should know, and it’s a mistake that we have made. And I would like to save everyone from making that mistake, and it’s also in our manuscript.
But if you go and take all your tissue box and you cut unstained slides now and you leave them at room temperature or in a file box like most people do and you try to test those slides in six months, you’re gonna have some issues. You’re gonna have a lot of, nonspecific background staining.
I highly recommend leaving that tissue on the formalin fixed tissue block as, until you’re ready to do your experiments.
Now if we’re gonna be doing a series of experiments over a month time period, that that’s one thing. You can cut those unstained slides off your tissue block, then we store them at -80 in a, like, a a little slide box with parafilm and a desiccator pack because you don’t want moisture and air to dry out those slides. So while you’re working with them, you can maybe get four to six weeks of time, on your unsane slides. But you’re like I said, it’s best to leave that tissue on the block until right before you’re ready to do the experiments.
Okay. Thank you. Here’s the next question we have. What marker would you use when cirrhosis transitions to HCC?
What marker would you use when cirrhosis, to HCC? So there’s c d two zero six and two c d two zero nine. So there’s some tumor associated macrophages that are really important, that have been known to suppress the immune response and allow the cancer to progress. So these tumor associated macrophages are actually a bad thing for cancer because they, they actually, like I said, they they allow progression and inhibit the protective immunity.
And so we are actually working on doing that at this point in time. It was looking at a lot of the the cirrhosis biopsies and determining if we had these TAMs present, before the development of cancer. And there there are several others that are in the pipeline as well. There’s a lot of publications coming out about these TAMs, but the pan one of our panels, the one that we use for the cancer development, is includes CD two zero six and two zero nine.
Okay. Thank you very much. Here’s the next question we have. What types of files do you use for your Visiopharm analysis, particularly your TSNE plots and phenotypes matrices?
Yes. So that’s the ones that I mentioned that, you know, that there’s different types of files that you include. For the Visiopharm, we use multi component TIFF files, and those are actually the imaging files that have all of the layers, present so that the Visiopharm team is able to whoever is analyzing the Visiopharm data, is able to actually look and see those, you know, all of those details of those different stains and be able so we we look at cell segmentation, which is extremely important. I’ll let Dan even talk he can even collab or add in on the end of this question. But those multicomponent TIFF files basically have all of the information for the imaging data that instead of in contrast, we’ve done some other types of analyses where we, export the cell seg files, which is just an Excel file, and that’s based on thresholding.
So that’s a little bit different. So there’s a lot of different ways you can output the data, but for the tSNEs and the phenotypes the phenotype matrix box that I showed, those were all multi component TIFF files. And, Dan, do you wanna chime in a little bit about how that those algorithms work?
Yeah. So, I mean, basically, at the moment, we’re our phenotyping, algorithms are are operating in Python, and so we can, generate some machine you know, we’ve generated some models for, classifying cells and and gen and auto generating that that phenotype list.
And, but, yeah, it’s using a a a form machine learning to do that and and sampling from all the objects in the image, all the cells, and looking at the underlying biomarkers and staining, and their intensities, within the each cell. So yeah. And then separating them based on positive and negative putting them into positive and negative groups for the each biomarker and then compiling that list.
Great. Thank you.
Alright. Thank you, Dan. Thank you, Heather. Here’s the next question I think is for the both of you. How do you design your algorithms and how reproducible is the data?
So I’ll start with the reproducibility aspect, and this was something that completely I I was really impressed by, was that I was working with doctor Freiburg for the last couple of years and developing algorithms and, as I mentioned, also with MD Anderson. And we did the, all of the work where I was showing you with the different disease types where I have the control, autoimmune hepatitis, viral hepatitis, and fatty liver disease. We developed the algorithms a couple years ago. And then when I submitted the manuscript, the algorithms had been updated a little bit, and tweaked a little bit where we could identify the phenotypes better. So, unfortunately, Ben had did not have could not locate the original algorithms that he developed for me a couple years back, but it actually has a plus side because he basically went right through and kinda just plugged the same thing in again, and I got the exact same data two years later.
So I was just, I mean, I was pretty amazed by that.
And then again as I mentioned to you as well, we have a way to double check our data because we’re very new to this type of, using, you know, this imaging algorithms and data. We wanted to have a double check. So we’ve basically taken all of the data that Visiopharm has produced for us, and we’ve also looked at it another way by using those cell cell seg files. We also collaborate with the University of Michigan, and their bioinformatics group, and we came up with the same exact pathogenic populations using two different types of data files.
And then our final way to check it was, as I mentioned to you before, is doing the NanoString, which is another platform optimized for FFPE tissue. And all all many of the genes that we found to be increased, like, the same receptors and things that we found, the c d fourteen and sixteen were up and down very exactly like the imaging data. So we have several ways to check the reproducibility, and and the reviewers were happy in our paper, and we’re very happy with the the platforms.
And if I can add something to that.
So at Visiopharm, we we offer we basically offer you a platform in which you can design algorithms, for your image analysis needs. And and basically, each algorithm, takes advantage of what we like to refer to as an infinitely configurable toolbox, which is highly flexible and powerful and, essentially, as I mentioned, allows you to craft any type of image analysis algorithm that you can think of, and Heather highlighted some of these during her talk.
In general, you know, from a larger, you know, or or higher level perspective, we recommend designing each algorithm in a modular fashion where each algorithm performs just one task. Like, for example, in this project, there was a cell segmentation algorithm that’s essentially standalone, and then another that’s the phenotyping algorithm, the the classifier to generate all list of phenotypes.
And and, as far as the reproducibility, if I can add a couple sentences to that.
So as within, the platform, Heather has already spoken to the reproducibility.
Certainly, if you were gonna run the samples again through the same algorithms, you’d get the same answer. But if you’re gonna add more samples to the study, we’d probably recommend that you evaluate whether staining is consistent with what the classifier has already been trained on. And if it matches, then you should be good to go, with those with those new images. But if the staining and variation is a little bit beyond the range of what the classifier has already been seen, you might need to recalibrate or retrain the algorithm with new images. But in general, what this will do is only make the algorithm more robust to the very staining variability that might exist across, you know, a a scaled study where you’re adding more images or more patients or what have you. So yep.
Okay. Thank you very much, Dan and Heather. Here’s the next question I have for you. Macrophages are notoriously difficult to isolate due to their irregular size and shape. Can you provide details on the strategy that was used to segment macrophages?
I think I’ll take this one. That’s a great question, and definitely spot on about the challenges associated with macrophage segmentation.
So the strategy that we used here, utilizes a cutting edge technology available, as an option in our software, and it’s, we refer to it as deep learning, option.
And what we’ve done is, we’ve taken this deep learning technology and trained it in house to recognize DAPI positive nuclei with, high fidelity.
And in customizing the algorithm for Heather’s data, we combine the DAPI feature that was generated by the deep learning convolutional neural network with some of these, notoriously challenging biomarkers that are specific for macrophages. A lot of the markers are in the panel. And by combining the nuclear signal with macrophage specific signals, this was then, allowed us to create a really robust algorithm that was able to accurately segment the macrophage population in her samples.
Okay. Heather, did you need to add anything to that? Or Dan covered it all.
No. No. And I’m still learning myself, you know, how to do all these. I I can segment cells no problem, but the macropodges are a little bit tricky.
So they, you know, help me a lot with getting these tweaked right.
So, yeah, I I think Dan is the expert in that area, so thank you.
Okay. Alright. And here’s our our last question. I do invite the audience to continue sending in their questions. We do have a little bit of time, but this is our last questions, right now so that I see. So here it is. What images were used to train the phenotyping classifier?
Did you use just control biopsies, disease biopsies, or a combination of them?
Great question.
So we use samples from each of the groups in training the classifier, and, the rationale behind this is by incorporating multiple images and disease types, we’re able to generate a full complement of the possible phenotypes, that existed across the entire panel of subjects, generate that full list, during the training. And then, as Heather showed in her presentation and in the published work, we can track whether particular phenotypes are up or downregulated in particular disease states. I think it was the CD fourteen, and then there was another, in the AIH, situation. There was another two phenotypes that were upregulated in in that category.
And so, yeah, I just refer to so by doing that and training across multiple images, you can generate a full complement of the phenotypes that are that exist and then track up regulation and down regulation. And so, yeah, we use, images from all the groups, in the training for the phenotyping classifier.
Okay. Well, thank you very much, Dan. So Dan and Heather, do you have anything else you’d like to say? Because we’ve come to the end of the q and a portion of the webinar.
No. I think I think that is good. And thank you again, everyone, and thank you, Visiopharm, for having me and all those who attended today.
Okay. And Dan?
No. This has been great, and thanks a lot, Heather, for, your work, and and it’s been a great collaboration with you.
It’s great. Thank you. I couldn’t do without you guys, so I appreciate it.
Okay. Awesome.
Okay then. Thank you. Well, thank you very much for those questions. We have reached the end of the question and answer portion of the webinar.
If you have any further questions, please direct them to the email address that’s on your screen. I’m gonna show you it right now. And there you go. And that’s Heather Stevenson Lerner.
Her office is four zero nine seven seven two eight five five four, or please email her at h l stephenutmb dot edu.
Thank you, everyone, for participating in today’s webinar. You will be receiving a follow-up email with x talks from x talks dot com with access to the recorded archive for this event. A survey window will be popping up on your screen. Your participation is appreciated as it will help us to improve on our further webinars.
Now I’m about to send you a link in your chat box. You’ll be able to view the recording of this event at that link and also share this link with your colleagues when they register for the recording as well. So I encourage you to do that. Now please join us in thanking our speaker, doctor Heather Stephenson Lerner, and also Dan Winkowski from with Visiopharm for that very insightful presentation.
We hope you found this webinar informative. It has been my pleasure to be your webinar moderator. On behalf of the team here at x talks, we thank you for joining us. I’m Sonia Hunt.
Until next time. Please take care, and bye for now.
Intrahepatic macrophages influence the composition of the microenvironment, host immune response to liver injury and development of fibrosis. In this webinar, Heather Stevenson will present her group’s findings from an analysis of five different antibodies commonly observed on macrophage populations (CD68, MAC387, CD163, CD14 and CD16).
Using a multiplex protocol, the group stained biopsies collected from representative patients with chronic liver diseases, including chronic hepatitis C, non-alcoholic steatohepatitis and autoimmune hepatitis. Spectral imaging microscopy and deep-learning-based analysis was applied and found to be a powerful tool that enables in situ analysis of macrophages and other cells in human liver biopsies and may lead to more personalized therapeutic approaches in the future.
-
- How multispectral imaging and deep-learning-based image analysis facilitates comparison and visualization of macrophage populations
-
- About spectral unmixing of fluorophore signals, subtraction of auto-fluorescence and preservation of hepatic architecture
-
- How cell phenotyping, tissue segmentation and t-distributed stochastic neighbor embedding plots can facilitate characterization of numerous cell populations
-
- How to optimize multiplex staining and spectral imaging microscopy
-
- Discuss types of imaging analysis available for multiplex stained tissues
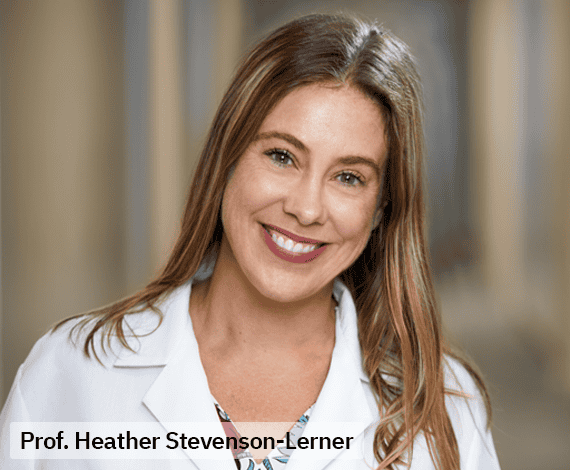
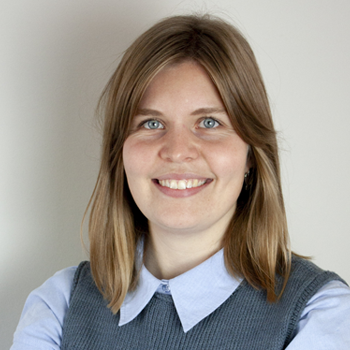
Heather Stevenson-Lerner, MD, Ph.D., FCAP, Asst. Professor, Dept. of Pathology Liver & Transplantation Pathologist, The University of Texas Medical Branch
Dr. Heather Stevenson-Lerner’s clinical focus includes liver, transplantation, and gastrointestinal pathology. Dr. Stevenson-Lerner completed a fellowship in the Transplant Pathology Division at the University of Pittsburgh Medical Center. Dr. Stevenson-Lerner leads UTMB’s Liver Diseases Diagnostic Management Team, which is popular with hepatologists, transplant coordinators, fellows, and residents.