Transcript
Hello, everyone.
My name is Amanda Lowe. I’m with , and we’re gonna kick off our pre conference workshop.
I know we stand between you guys and the reception, so thank you for being here and, for this last session this afternoon.
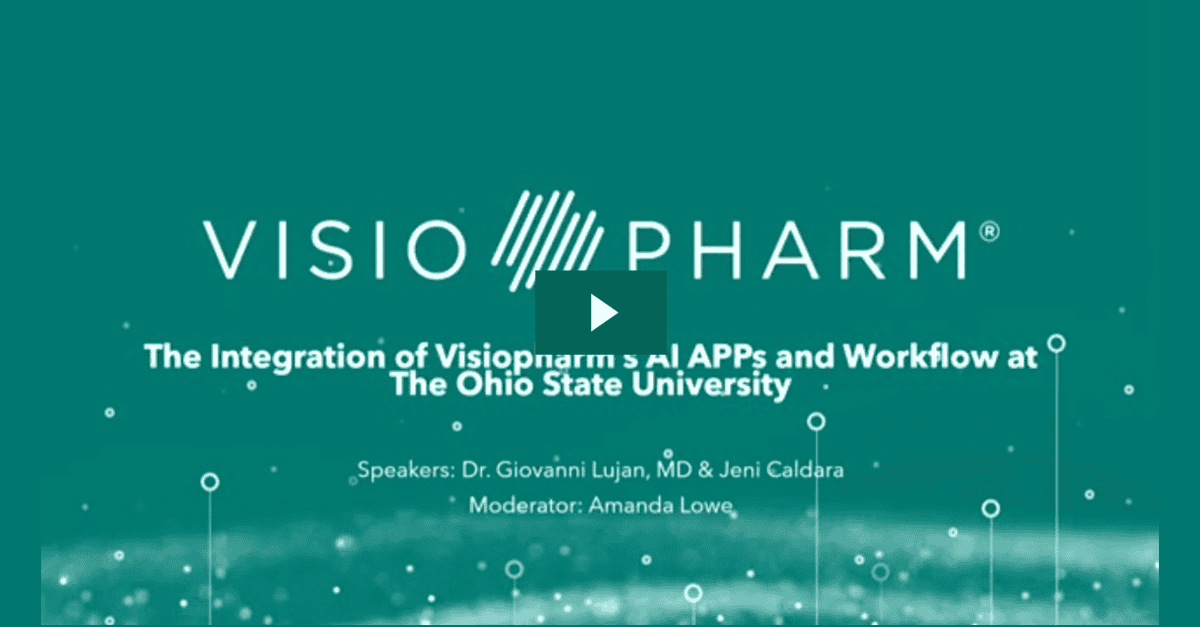
So we have two wonderful speakers joining us today, and we’re gonna discuss the integration of our AI apps and workflow at Ohio State.
So in addition to myself, who just will be moderating with my fellow friends here, I have Jeni Caldara. Jeni is an innovative digital pathology professional that has spent the sack the past six years in AI based image analysis and workflow implementation.
With an education in cell biology, she enjoys generating creative AI solutions, which highlight tissue specific processes.
Jeni is a technical sales specialist with us here at Visiopharm, and she’s based out of Colorado, where she focuses on our translational product offerings and incorporating it into our existing systems and workflows. She’s also a huge she’s very passionate about PD-L1. She’ll She’ll talk a bit about that today too.
And we have Dr Lujan, who is an associate professor of pathology at the Ohio State University College of Medicine.
He’s a GI pathologist and also the associate director of digital and computational pathology at the OSU Wexner Medical Center and the James Comprehensive Cancer Center. He’s a board certified in anatomic and clinical pathology with his expertise in GI pathology and over fifteen years of experience in the field. We’re very excited to have you both with us today.
So thank you so much. But before I turn it over, I have a disclaimer and I think so does Dr Lujan.
So our disclaimer here is just all products that are mentioned in this presentation are research use only, not for use in diagnostic procedures. We do have products that are marked for CE-IVD, and they are for only for use in Europe.
And that’s it. I will turn it over to the two of you. Thank you.
Okay. Hello, everybody. Thank you for staying until the end with us today. Thank you for to Visiopharm for inviting me to share this exciting times with them and with you.
I have a disclaimer of my own that I have to present to. Any opinions expressed during my participation are my own as an individual, considering my academic knowledge and experience on the topic, I will be discussing and should not be construed as representing a position of my employer, which is the Ohio State University, Department of Pathology, or any of its affiliated institutions, faculty, or employees. Neither should this be considered an endorsement by the Ohio State University of any commercial product mentioned by the speaker.
And that’s that’s my disclaimer. But after that, again, I’m very happy to be here with all of you.
A little bit of of story. Why, Visiopharm reach out to us to be their witness on this, exciting times, this milestone?
Because the Ohio State started working on digital pathology a long time ago, probably earlier than most institutions in the United States. And that was in twenty sixteen.
I wish I was there, but I wasn’t.
I’m a relatively new addition to the Ohio State University team I joined last year. But back then it was doctor Anil Parwani, doctor Wendy Frankel. Those were the visionaries, without whom it wouldn’t be possible for the, institution to be where we are. So I basically just came and riped the benefits. Lucky lucky me. Right?
And, anyway, twenty seventeen was when the, as you remember, the first scanner WSA scanner was approved. Not only the scanner, but what was called the pixel line.
And from there, they were before that, they were scanning only retrospectively for archival purposes, research.
But starting then, the plan was to launch a digital pathology for primary diagnosis, and in fact, that happens.
Twenty nineteen was a milestone for the Ohio State because they adopted PICR, the companion for EPIC, which was the medical record system they were using, which, allowed for a smoother smoother alignment of those of the whole, workflow.
Then, twenty twenty came about, and you know what happened. The pandemic happened. And with that, what had been just kind of few steps in becoming totally digital became a reality.
The Ohio State became probably one of the first institutions in the United States that we were completely digital.
Pathologists had the opportunity to sign out remotely from their offices without interacting with anybody, not even delivery of of of, slides, not even technicians, or they could sign out from home, from the, comfort of their own home. Either when they were scared because they didn’t wanna face too many people or because they were quarantined, you know, that you had to go for fifteen days was at the beginning. And if you were not symptomatic, you didn’t have to take the time. You could continue working as usual just from your own home. So that happened then. Now it’s twenty twenty one and beyond, and that’s what we’re here to talk about, what’s beyond. This, just kind of give you a panoramic of some of the milestone that we’ve been, talking about, that we’ve been reaching because we’re digital that has opened the doors for many, many opportunities to have partnerships like the one we have with Visiopharm now developing algorithms for AI.
Also, with other institutions that are smaller inside, that they don’t have a specialist within the state of Ohio. Some international partnerships as well. Some publications, I think we are this was a few months ago. I think we have almost doubled the number of publications by this time.
Recruitment is allowing us to, be more attractive for those people, especially for this new generation of millennials and post millennials who wanna train and are focusing their eyes in the future, and they wanna develop the skills in all these technologies.
Of course, education was something that, it was heavily impacted everywhere because of the pandemic.
People couldn’t teach in person, and they were not ready to do it remotely, especially for pathology that, as you know, we have to interact.
We have to double head, multi head, and whatever.
Now for us, we didn’t interrupt the the teaching for one single day. We were able to go digitally. We have the structure. We was just a matter of develop developing a plan in all the lectures, sign outs, tumor board. They were digital pretty much overnight and they have remained since. Again, this was a very unfortunate event, but it shows the big advantages to be without knowing and pandemic ready.
So what are we pursuing with Visiopharm now?
Well, we’re pursuing the holy grail of digital pathology, and we’re doing it together, which is to go and start get to this next level.
Digital digitization put us at the entrance of the digital era. Computational pathology, precision pathology, many names. I don’t know what will be the final name, but the fact is that is this era where we can not only base our, diagnosis on morphology, but in all this array of different diagnostic tools and put them together. And that way provide a better service to our patient as computational pathology. And just to clarify, this is not a fight between men and the machine or artificial intelligence. Absolutely not. This is a collaboration.
And any doubts, please, we’ve been doing this for a year and a half. And so we can tell you there is nothing to worry about in terms of pathology. The only thing that is gonna happen is gonna make this better, more reliable, that our findings will be more reproducible.
And we’re gonna talk a little bit about that.
Alright. Well, I’d like to take credit for the developments happening with Ohio State, but the truth is there’s a whole team behind the Visiopharm work that’s going on. So a quick snapshot of what we have behind the scenes. We’re sitting at about a hundred and ten employees.
We have lots of different departments within these employees. So we have support experts to help you along with your development, a whole dedicated team of software engineers. We do host a lot of different nationalities and over fifty percent of us hold a higher degree.
We also have eight patents, over three thousand peer reviewed publications, a hundred and twenty ready to use apps, and we’ll touch on some of those today. Eight of those being CE IVD approved in Europe.
We like to say that all of our software is rooted in AI, and I think you’ll see a lot of that come through with these examples today.
We’re also celebrating our twentieth anniversary of being in business.
So with that comes a lot of expertise and experience.
We work with a lot of popular vendors to make sure that we can come in and we can fit into your existing workflow so that we’re not adding any extra steps along the way, and it will be a nice flow.
So what does that workflow look like? Well, Visiopharm’s goal is really to arm the pathologist with the latest technology so that you can really get the most out of your staining data. There is so much information hidden in these stains and in the tissue.
So this is your typical workflow as it stands today. You would start with obtaining the biopsy, going through an examination, a manual assessment, and then some further analytical review.
Visiopharm is going to plug in right here. After your sectioning and staining, a lot of you are probably already at that point where you’re digitizing your images. So our image analysis is going to fit in right after you’ve scanned those slides.
There are some barriers that were traditionally a challenge with some of the traditional image analysis approaches, but having the approach of AI has really let us overcome a lot of those.
So we do have automated batch processing, so we can run multiple samples at one time, really saving a lot of, effort for that person running the samples.
We can do that tissue microenvironment analysis. So not every paradigm requires that analysis, but I think we’re seeing a lot of those manual paradigms that really require those complex cell interactions that might be happening in the microenvironment to be visualized.
We’re also hoping to give consistent and validated precise data. So every time you’re running the algorithm on the image, you know you’re going to get the same answer.
Again, I like to touch on our different, partnerships and vendors that we hold close because those really allow us to integrate right into the workflow that someone like Dr Lujan has in place, whether that be the image management system or the laboratory information system, anything like that.
So these are those hundred and twenty apps that I mentioned at the start. This is our app center, but we like to call it our inspiration library. So these algorithms could be used as they are. You could take them. You could tune them to your own staining, scanning, any parameters that might be a little different.
They also make a really nice base if you would like to further develop them, get additional endpoints that maybe don’t already exist in the apps as they are right now.
Two that I thought I would point out today. One is our KI67 algorithm in neuroendocrine neoplasm.
So what you’re seeing here on the right is the markup of the tissue where the tumor regions have been identified, and then we’re able to do a cellular analysis within to find that, Ki-67 proliferative index.
We can also do some different hot spot approaches, and we’ll we’ll touch on those a little bit later too.
I also wanted to highlight our CD three colitis app. So this is really great because it can find different compartments in the tissue. So it can find the tissue border, some of the intestinal glands, some of the more, was it, surface surface areas compared to the rest of the tissue and maybe normal structures that exist within the glands.
Yeah. Any pathologist, any type of pathologist, we know that. How can we emphasize not only the colon, but small intestine?
It’s not a very pleasant task. Very, very unreproducible.
And, there you have it.
Well, with this app, we can quantify those c d three t lymphocyte populations.
We can do some further support for the pathologist as doctor Lujan mentioned.
I also really wanna take you through our breast cancer workflow.
Visiopharm is really an industry leader when it comes to breast cancer analysis, and we boast that full panel of quantitative analysis.
This workflow is really intended to mimic what the pathologist would be doing manually when they’re approaching scoring one of these samples.
So first, the pathologist is going to identify the tumor regions within the sample.
We offer an AI assisted selection of tumor regions. This is really great because it doesn’t require the use of a secondary cytokeratin stain, a serial section.
There are some different workflow options we’ll touch on, but you could put this in the hands of a different researcher, and then the researcher could run this algorithm without having to have the initial, assistance of someone like Dr Lujan and their precious time.
From there, you’re gonna run your biomarker specific algorithm. This would be your ER, PR, Ki-67, and HER2. We’ll touch a little bit more on each of those and the endpoints that you can achieve.
We also offer some auxiliary algorithms. I mentioned that hot spot detection. So identifying a secondary region of interest at the hottest spot of activity.
And we’ve also been working a lot with Dr Lujan’s team on the metastasis detection app.
So as you probably have figured out already, I’m a big fan of AI.
So I love the digitization process, and I love how artificial intelligence can help us. Well, Visiopharm has been working with OSU for several years now in the research arena, developing kind of testing these applications.
And now we’re ready for deployment, clinical deployment.
So when we started with that, well, I started looking at their app catalog.
Can you imagine? Me and my excitement, there there was like a kid in a candy store. Right? And they told me that I could choose one or two or three, and I was like, no.
I want them all. No. But no. That it doesn’t work that well. Right? You have to start with small steps and then move forward.
Many considerations were made, not by me, but the by the whole team, but we will be more more, important to start deploying in which, the things that we consider was the volume of test that we were doing, the time consuming, how much time consuming they were for pathologists, how tedious they were.
And, another very important factor was the fact of how reproducible they are. You all know pathologists in the room how we have some diagnosis, some tests, some a test that you cannot get the same answer three times in a row that goes up and down, up and down. And it’s the that variability is normal, right, for the human eye. So we consider those, and, we chose to start with HER2, ER, PR, and Ki-67.
Many more have since then been also in the works in the way we do at this use. We just start selecting the team of what we call the super users of digital pathology. Those that are very, very interested. They each start developing or working with an algorithm.
And we just use it and start, working with it, providing feedback, adjusting it, seeing the results, getting comfortable. Now we’ve been doing this for six months, and we’re ready for the next next steps.
Alright. So to get where we were today, we worked closely with some of the technical team at Ohio State working in their digital pathology lab.
And we really developed a workflow that was going to be efficient for the team.
I tend to see two different roles emerge. One would be an operator role, someone who’s actually running that analysis. That might be your super user, and then a reviewer role. That’s typically the pathologist.
Sometimes the pathologist can play both roles if they’d like to also sit in that operator seat.
So we really started this by creating a sandbox environment. So what’s a sandbox?
It’s really a controlled testing environment, and we intend it to mimic the environment that we would then do the deployment in at Ohio State. So this is a physical workstation that is sitting in their scanning lab, that has a deployment of the software and the algorithms at hand.
So this operator role is initially downloading a case from the image management system. That’s being streamed directly into Visiopharm.
I really like the process of streaming the image because it removes the need to duplicate the image to import it, and therefore duplicating some of those storage needs, which I think a lot of pathologists are starting to try to understand how to manage those storage needs now.
Once the case is in the IMS or I’m sorry, out of the IMS into Visiopharm, that operator is gonna run those biomarker apps that I mentioned previously. So for the breast panel, that’s going to be that automated AI based tumor detection, and then the biomarker specific app, so your ER or your PR.
They can then alert the pathologist that the analysis is complete.
The pathologist could come in and perform a markup QC.
They could also evaluate that tissue data that’s being released, and they could make any adjustments as they saw fit. Maybe Dr Lujan sees some normal tissue that shouldn’t have been analyzed. He still has that final say and that control to make those adjustments.
So these are the apps that we really started focusing on as Dr Lujan mentioned.
The first is the H and E Metastasis Detection in Lymph Nodes. So this does utilize a deep learning neural network.
It identifies metastasis within the tissue. Sometimes these are really small or these are floating tumor regions.
These areas are then denoted, circled by the software for the pathologist to quickly zoom into and review, and there are also some quantitative endpoints available. So some popular ones have been that largest metastasis diameter or area.
Ki-67 neuroendocrine neoplasm has also been one we’ve been working together with. This does utilize that AI based tumor detection, as well as deep learning to segment those nuclei.
Those nuclei are then quantified for Ki-67, and we calculate that proliferative index within the tumor regions.
We do offer this hotspot identification that I’ve mentioned a few times. So what you see here is a heat map, and the areas as you approach red have a higher amount of Ki-67 activity.
So the software that can then place this red ring, around that hot spot and recalculate the proliferation index within that hot spot.
ER and PR have also been underway.
This also utilizes that AI based tumor detection and deep learning to segment the nuclei.
What I really like about the ER and PR apps is that they have a lot of different endpoints available.
Again, we want to put these apps into your workflow and have them really mimic what you’re already doing manually. So we want to be able to report out the data that your pathologists are already reporting out.
Percent positive, maybe that’s an H score, or even an all red score where you have the intensity and proportion scores.
We’ve also been doing a lot of work with HER2.
So that HER2 app works by finding DAB positive linear membrane on the tumor cells.
It looks at the connectivity, and it says, does this really look like that kind of chicken wire mesh pattern that’s indicative of a three plus sample? Or are these membranes more fragmented like a one plus or a two plus sample might have? So that connectivity is then relayed into your classic zero to three plus score.
We have seen some studies.
I’ll let Dr Lujan speak to them a little bit too.
Where we have correlated back the algorithm to, fish testing. So that could be your HERT and SEP seventeen copy numbers or the ratio.
Did you wanna share anything about the publication that your team has worked on?
And I know doctor Lee is around this conference somewhere and speaking a few times, so I’m sure he wouldn’t hate if you pester him a little bit about it.
Yeah.
Alright.
And, anyways, so this is what we’re doing right now, testing algorithms that they have already developed and tested with different populations.
But what’s the path forward? They, also are open for us to work or to work together with us to use their platform to develop our own algorithms.
So think about it. Do you personally, what do you would like what would what would you like for, a computer to do for you?
I’m a GI pathologist. So you probably can imagine what my first choice will be for next. Right?
Sure.
X h pylori.
We spent too much time looking for the bug, and I wouldn’t say it’s time wasted. You know, it’s a small bug, very treatable, but it causes two type of cancers. This is not an association. It’s cause effect relationship.
So missing one is is it can have great impact in our in our patient population. And for us, it takes a long time, especially not when there are thousands of them on the surface, but in cases like that over there. I don’t know, if you can see the three bugs in there, but to find those three is hard. So now I said, okay, Jeni.
I I wish I had that.
But we don’t have it yet as a matter of fact.
I think that’s my hint that that’s the next one we’re supposed to work on.
If a request like that does come through from Dr Lujan’s team, then we were able to utilize the super users that Ohio State has really built up on the research side of their tools. So these researchers have been using Visiopharm for years and years. We’ve really seen their skills explode. They are great at building these AI algorithms.
And we have some additional tools that those researchers can use as they develop these new algorithms from the beginning. Or they further use utilize some of those, inspiration library algorithms and train them further, create additional endpoints.
Visiopharm really uses a modular approach when it comes to building your AI solutions.
So you saw earlier from the original stain, we interrogated where are those tumor nests, and then we could take another step in and we could look at the nuclei within the tumor nest. We could even use a serial section to do metastasis.
This is Visiopharm’s authoring tool that I would be using to build these neural networks. It really utilizes a teach by example sort of method.
So the technician that might be building one of these algorithms could partner with the pathologist.
They could tell the algorithm, these are the h pylori and the h and e that I want to identify, manually mark those, train the deep learning network so that when the network then encounters those h pylori and a true sample, it knows exactly how to handle them.
The app authoring tool requires no coding experience to use it. So I think it’s really great to put in the hands of these technicians that have a biology mindset but also want to take a step into the AI.
I have a few more examples of algorithms that have been built recently using this authoring module.
So first is this NASH NAFLD example where we are trying to reproduce that NAFLD activity score on an HNE.
The NAFLD activity score is made up of three different components. First, you have your inflammation score.
What you see here is my inflammatory nuclei are identified in this dark green, and then when we see those inflammatory nuclei existing in a certain density, we identify it as a foci.
The count of the foci is then related to a score, and that’s how you come up with that inflammation.
Next is a steatosis score.
We’re working with the steatosis score by identifying hepatocytes within the liver.
We’re expanding on those hepatocytes to see, do they exist next to negative space left by a lipid, or do they have a nice fill near them where we probably aren’t seeing that steatosis occur?
We could look at the percentage of the hepatocytes. We could also look at a density, and using that, we could reproduce the steatosis score.
The last component component of the NAFLD activity score is hepatocellular ballooning.
So we are able to distinguish the hepatocellular nuclei from those inflammatory nuclei, and then we can look at the cytoplasm right outside of the nuclei of those hepatocytes. So does it have a nice dense fill like we would expect for a healthy hepatocyte, or is it kind of clear and has this different texture that the balloon hepatocytes tend to have?
And then we would use the quantification of those to define the ballooning score.
Your inflammation score, steatosis score, and ballooning score would then be added together like your traditional manual paradigm to give you that NAFLD activity score.
Along with that, we tend to produce fibrosis staging.
So this was done with picocerious red. You could also duplicate a similar approach in a trichrome if you’re using trichrome staining.
But the fibrosis score really requires that we understand where the perisinosoidal space is, the periportal space, and that we have the ability to use AI to look at some of that bridging fibrosis.
So first, you’ll see here I have a portal triad outlined in blue, and then that periportal space is defined in yellow outside of it.
The picocerious red staining is then, identified.
So you see the periportal fibrosis in teal and that perisinosenoidal fibrosis in green.
After we’ve quantified those, we can also identify the bridging fibrosis as another metric behind assigning that fibrosis score. Amanda mentioned I love PD L1. I find it so fascinating. So please come talk to us about PD L1. Come talk to me about PD L1.
But what we’re really seeing, especially in PD L one, is that there are these complex manual paradigms.
So we’re no longer just looking at a percent positive in the tumor. We have to quantify the microenvironment. We have to quantify immune cells separately from tumor cells if they’re infiltrated, and that’s really hard to do with traditional image analysis methods. You need the AI to really be able to pick out those different nuclei types.
So you see here two, PD l one stains.
If I were to approach these with an AI based approach, I would first, again, utilize my nice, deep learning tumor detection, find those tumor nests, and that’s one way that I’ll be able to differentiate tumor cells.
But there are infiltrating immune cells often within those tumor nests. So, again, that’s where the AI steps in, and it can help me differentiate those.
So in teal here, I have those inflammatory nuclei picked out within that tumor nest, and those tumor cells in blue.
On your right, we further quantify those as negative or positive for PD-L1 So you see the positive cells in red.
Because we’re able to have this breakdown of those different cell types, we can reproduce some of those challenging manual paradigms, so maybe your immune cell positive scoring or your combined positive score.
I also have a prostate cancer example.
This is the process that the pathologist or the technician would take when they are running this analysis.
First, you would simply load the h and e. This could be done on a single sample or if you have a whole batch of samples for the day, you could run them all at once.
The algorithm first outlines the tissue. This does two things. Number one, it gives us tissue area for the biopsy on the slide, but also it keeps us from running analysis in the negative space where the glass is, so it makes the algorithms much more efficient down the line.
From there, the AI detects any tumor regions, and it’s gonna outline those in red.
Those red areas are then nice and quick for the pathologist to zoom into and review, confirm if that area is tumor. Then you can also have quantitative outputs like a ratio or a tumor area.
What I really like about being able to run some of these samples in a batched approach is we can also reorder them within the software based on their end points. So if we really want to prioritize some cases that are identified to have a certain tumor ratio, we can put those towards the top for review. If we wanna look at negative samples first to confirm that they’re negative, we can prioritize those instead.
I also wanted to talk a little bit about the impact on the pathologist.
One way that we’re looking at this is the Ohio State team’s researchers are generating some time studies and sharing those with us.
We started off in HER two.
We’ve also done it in ER and our Ki-67 in neuroendocrine.
I always love seeing these times because these are some complex algorithms to be running. You’re identifying those tumor nests. You’re identifying nuclei. You’re segmenting nuclei.
You’re quantifying the biomarker positivity. These are not simple tasks. So these are some really great run times that we can understand to make sure we’re creating an efficient work flow for the pathologist. Dr Lujan, I’d love to hear a little bit more on some of the manual times it might take you for some of these tissues.
If you remember what I I was telling you at the beginning, the what the factors we consider to start testing these algorithms was, how time consuming they were, how important they were, how reproducible they were. And I personally, vouch for Ki-67 in the oral endocrine tumors. Being a GI pathologist, we deal with a lot of those. And as you know, the WHO decided to put them as criteria.
And, the criteria of the, calculating the proliferation index based on Ki-67 positivity.
And I think that you would agree that a lot of times we can get away with just eyeballing.
And if it falls between this kind of separate categories, like very little or a lot of it, then we don’t have any problem. Same with PD-L1. Sometimes we don’t have problems with that, just kind of making an estimation, rough estimation.
So even though there is a lot riding on that response, we feel confident that our eyeballing is is accurate. But what happened when the that eyeballing get us close to the threshold, we all have experienced that. When we count and we recount and we give it to our neighbor and the neighbor get two percent, the other neighbor get five percent, then you get three percent, and so what to do? Because, you know, a lot of things will happen based on that number.
And sometimes, I think we have all done it, that we have we, do the immunostain. We take a picture. We print the page, and then we start crossing them out. Sounds familiar?
And half an hour went by. Right? And this is just a few a few seconds, and it’s gonna be reproducible. The same purse the next person will get the same result.
In a month, you will get the same result. So I was very very happy to see when you see this kind of palpable experiences, when AI is really making a difference. And right now, we are just annotating all the times that it takes him for the algorithm to produce an answer, and we haven’t analyzed it yet. We haven’t published anything. We’re just kind of keeping the numbers, and we’re sharing the numbers with you. And, a summary of this will be will be forthcoming.
I think I’ll let you just take the next one.
So what our goals, as I told you before, getting after that holy grail in diagnosis, which is kind of being accurate. Right? You wanna be certain.
And, pathologists, pathology has always been described as part science, part art, And the art is what makes it beautiful to us because we have to use a lot of our our intelligence, a lot of our facts, all our experience, our collective experience to get to that last diagnosis.
But the downside of that is that it’s not reproducible sometimes, like the concept of beauty. Sometimes you say, oh, that nuke we say, oh, that nucleus why is it malignant or because it’s too ugly?
But that could be in the eye of the beholder. Right? So our goals are to first become more quantitative than qualitative. Give you numbers and and and draw numbers as data rather than being, relying on these concepts that are in the eye of the beholder.
We want to provide tools that will give decision support to our pathologist in what could be a more reproducible standard way. So, you know, we all have rules and criteria to diagnose entities, but, you know, they everybody starts adapting and adjusting those criteria based on their own experiences.
And, you know, like, if you wanna and pathologist won’t let me lie. If you have a diagnosis that you want you think it’s malignant and you want somebody to concur, you know how to go to. You know who’s the malignant pathologist. If you want them to call it benign, then you know who you go to because on that other person will not call it for sure. And you know that. Right? How our thresholds vary depends of of our own experiences.
And, so that’s that’s one of our goals.
We wanna expedite the real time by kind of having it’s like having a great resident, right, that previews all your cases and gives you the stuff where you have to go and look at more carefully. Rather than scanning, eighty slice of prostate, you just have few where you can go. If if you see that the AI highlighted the whole issue, then there is no point. You will probably be able to diagnose the cancer even on the gross slide. But this is for those cases that are harder than that.
Using AI, basically, we compare it to start, having a good resident that highlights your thing or a second pair of eyes that review what you did after you did it. That’s another use use case of it.
And another goal is to reduce the turnaround time. Again, we’re just that’s our goal. We’re right now, we’re just tasting it and taking notes, but, ultimately, we wanna prove without the shadow of the doubt that this will definitely make us more efficient.
Not not only effective, but more efficient.
And this is a very, real life story. This is my colleague, doctor Shaoli Sun, and I’m sorry that she’s not here right now. She’s still in the in the in the conference, but I don’t know where she is. But the, I was working with Ki-67, and she decided to start working with the metastasis identification algorithm.
So as I was telling you, this is a process where you start using the algorithm. Jeni explained they put it in what they call a sandbox, which is, like, you we have our workflow. Right? We have the, electronic medical records, the LIS, the IMS, where we see the images.
That’s our workflow. So the sandbox comes and sits on your computer or a different computer kind of on the side. And if you wanna analyze one of your cases, you just kind of move it to that sandbox, and then you play with it. You save it.
You do whatever. And we do that for a period of time till we are comfortable with the algorithm to start kind of working on a more focused way. So doctor Sun was in that phase when she was getting acquainted, and what we do is, you know, we put it we use it. We found the metastasis, but then we put it and we see, oh, the machine found it too.
And the machine didn’t find it. It’s like, oh, we need to tell Jeni. And she emails Jeni, you know, there was this little metastasis that I saw and the machine did it. So look at that.
And probably was some little thing. I mean, things can go both ways. Right? Well, this is when she got the first experience when they it got the other way.
She went through the case, and she’s a very superconscious pathologist.
She went through the case and she call it negative and, you know, she was ready to sign it out and all that. But before that and you can choose if you wanna run the algorithm before and have your good resident mark the areas, or you can do what she’s doing that she does it herself, That.
And then goes and run it against to the algorithm.
So guess what? So on the left, you can see that little circle that she put in there.
So she went through and she missed that spot.
When she run it through the algorithm, the algorithm circled that. That’s not the this is her circling it, but there there’s another picture where the algorithm kind of circled in yellow.
And, of course, she panicked and, like, oh, no. I couldn’t miss that. And she did the the immunostain to to, to prove it. This was a case where she got, like, twelve different nodes, all negative.
That was the only MET. And it’s not necessarily I mean, it’s it’s a small MET, but it’s it has enough to be called a cluster. Right? And, anyway, so this was she sent oh, and that’s a that’s a copy verbatim of her algorithm of her email that morning when she emailed the whole department that she had found that or that the algorithm found that that she had missed.
But she was very thankful that she was able to to revise the report before it went out. So real real real life example. Very excited for all of us. I think we all stopped and and kind of thought, okay.
We’re doing something here.
Well, finally, some thank you notes.
I’d like to thank doctor Eric Glassy for allowing us to use some of his images.
Doctor Anil Parawani and doctor Seiboli for their guidance. Those have been my mentors through my whole time at OSU.
David Kellow, who is sort of he’s just a he he has his position is a consultant for AI, but he does so many things for so many of us. He’s started by, you know, step by step guiding learning himself, then learning what he was doing and teaching all of us. He and Jeni spent hours basically going through the different processes. Not some of us are very good at that, but some of us are not very good at that. But they take the same patience to until they get us to the other side. And finally, a big thanks to doctor Xiaoli Sun for allowing us to use her likeness in in showing her her email and how this really can make a difference.
Great. Before we, open it up for any questions, just wanted to take a minute to thank everyone for joining us today. I know we’re in between you and that reception as Amanda said.
Please come see us at our booth. We’ll be at three zero two and three zero four.
We’re happy to give you some demonstrations, talk through some other applications, or hear a little bit more about maybe what you’d like to quantify in your lab.
I’ll also be at poster number nine, so please come pay me a visit.
I’m very excited to talk about some different nuclei segmentation methods that we’ve been working on to improve that quantification.
I have an advertisement too since doctor and I are have put together a presentation.
It will be on Monday at noon, I think. Please come see us too. We’ve we’ll explain to you not the history, not the tech not the technique stuff, but step by step, how we sign out digitally, glassless and paperless.
Give you all the nitty gritty details of how we’ve been doing it. I think it will be interesting.
I’ll invite Amanda back up, and I think we’ll open it up for some q and a if anyone has any questions they’d like to ask.
Yeah. We can just walk up to the microphone or I am happy to bring this around for anyone who needs it.
So, one aspect of usability that I think no one is paying any attention to is is audio.
Playing triumphal music when you finally get a classification to work or while it’s thinking, it should be making kind of thinking noises when it’s doing it. Have you ever considered adding any audio cues to to your software?
You’re looking at me.
So I guess I’ll answer that. No. We haven’t.
I hope it doesn’t take that long that we have to put in, you know, time killing music, kind of like I had to do while we were waiting to get started here this afternoon.
Well, I I actually helped, I think it was Hamamatsu. They were they were, to to develop an interface for users just to install new camera drivers because the cameras used to be sixty thousand dollars and they could afford to send a, a technician to actually install a camera. But when cameras went down to fifteen thousand, they’d have to have the users do it. And so they had to come up with a kind of software to guide them through it. And I proposed, at when they successfully ended that there should be a triumphal, song from the city of Hamamatsu. The city of Hamamatsu is phenomenal music and and, it would have been very rousing when you get the whole camera installed and then this, you hear this chorus just swelling up, but they didn’t do it.
Exactly. It sounds like a request for the software engineers. Got it.
Yeah. Standing ovation when when it finds something that starts clapping for you or, fun feedback. What else? Other questions for the team here?
I’ll throw it out there. Dr Lujan, you know, obviously, you guys have been doing this at at Ohio State for over five years now.
I as you mentioned, the pandemic kind of pushed things forward.
But in general, how are pathologists adopting? Was there a lot of hesitancy?
You know, I’ve always said there’s a psychological barrier that we all face in the industry too. So so talk through a little bit about those mental hurdles. And are you seeing similar things on the AI side, or is it is because they’re signing out and reading digitally, they were open to the AI? What are your thoughts?
Well, it’s in inter interesting because I I think it’s, it’s going to work both ways because I’ve seen some pathologists who were not that crazy about digital before. But now with the eye, they are all over the place trying to even get their own algorithms. And, of course, in order to do that, they need to be super users. So they need to go through the whole, deployment of to be super user, what you need to do is to basically not receive glass glass in your office.
That puts you in that that category that we’re kind of becoming snobby about. I’m kidding. And the reason I’m, is actually a joke is because doctor Parwani and doctor Franco from the beginning of this journey, they insisted that nobody will pressure anybody. Everybody goes at their own pace. So it’s been slow. The adoption, always progressing, but since they started in twenty seventeen till twenty twenty when the pandemic arrived, there were only, like, a handful of pathologists being superuser, maybe five. And there were a group of pathologists who were not using it at all.
And then most of the group were, like, some type type of hybrid.
After the pandemic, everybody moved to digital to one or another degree. So we are hundred percent digitized now from the beginning. Still, I would say, still most pathologists still use a hybrid method. And if this is very expensive, and right now we are calculating the cost of that because what we do is we digitize everything first, and then we still deliver the slides to those pathologists who want them. And and that means that we still have a big overhead in terms of delivery and retrieval and all that, which is one of the steps where you can actually save money. Now with the eye, again, some of those pathologists who were not that excited now are getting into it. And I do have some also that think that this this is dangerous, uncharted territory.
And we are as we are easing into it, we are just, you know, keeping our eyes open and trying to to do to do the right job and to, document everything we’re doing so it can help other institutions.
We have the big advantage that, in Europe, this has been done for for many years now, for a few years.
And Visiopharm is based in Europe, so we have that kind of interaction that may help us to kind of tackle what have been problems over there or or challenges.
So everything is is is exciting, but, yes, there is a lot of things that we don’t know yet. So we’re trying to kind of tackle one problem at a time, one issue at a time. But overall, it’s it’s always moving forward. Since we started we don’t having had one pathologist that became digital and went back.
When you become digital, that’s it. That’s the end of the class for you.
Thank you. Any other questions?
Alright. Well, I can’t leave Jeni to not answer one also.
So on the technical side, Jeni, there’s, you know, a lot of people like to think AI is magic. It’s not. There’s a lot of work and effort that goes into to making it perform like magic, but it’s not magic. Right? There’s there’s a there’s a wizard behind that screen, making everything come together. So, you know, when you think about, training data and and prepping, you know, to use a deep learning or neural network type approach, how much data do is typically needed to go into an algorithm to get it to, you know, perform?
I get this question a lot.
It’s really hard to give an exact number, and that is just because every disease is specific.
Every degree has a different amount of heterogeneity or change between different disease states.
So it’s it’s really challenging to give a direct number. Sometimes you only need to have a few samples where you can identify a specific event multiple times in that sample to give a nice training to a neural network. Other times, these are rare events, and so you have to use many, many more samples where you can find these rare events or even negative samples to train something really robust.
What’s great is something that Dr Lujan mentioned earlier, which is that if you are using an algorithm and you come across a really unique case, Ohio State comes across some very rare subtypes of diseases, unique cases.
And if the AI doesn’t perform exactly how you’d like it to on those cases, that’s an opportunity to further train the algorithm. So we can take that information, we can correct it, we can feed it back into the algorithm so that it’ll know exactly what to do when it encountered something like that subtype next time.
The deep learning is also nice because it adds a level of robustness that’s challenging with traditional approaches. So you’re not just relying on size and color intensity.
Now you can rely on things like texture and orientation, really unique things that the AI can pick out. That allows for a pretty robust training set.
We also like to say consider the images that you’re feeding into the training.
So are you feeding in these nice clean images so that the the deep learning can train the best it can? Are there a lot of artifacts? Is there a lot of facts? Is there a lot of drift in your staining? If so, you might need to adjust some of that training set to make sure that you’re accounting for all of that.
Thank you.
Alright.
Well, I’m sure everybody’s ready for some appetizers or maybe a cocktail.
So I know there’s a short break, but just wanna thank everybody again for being here today and for joining us. We look forward to seeing everybody, at our booth or at the poster and and spending the next couple days together. So thank you again so much for being here.
Artificial Intelligence (AI) continues to serve as a valuable tool for innovative pathologists and scientists looking to extract quantitative tissue data. AI APPs empower readers with another data source by highlighting features of interest, including tissue compartments, tumor volume, biomarker positivity, hot spots of cell populations, and more. During this workshop, Dr Giovanni Lujan, the Associate Director of Digital and computational pathology at the OSU Wexner Medical Center and OSU James Comprehensive Cancer Center, will describe The Ohio State University’s adaptation of a fully digital workflow, highlighting their work with Visiopharm’s AI-based software and APPs.
To provide additional technical application details, Jeni Caldara, Visiopharm’s Translational Technical Sales Specialist, will describe the algorithms and workflows underway at The Ohio State University. Jeni will dive into endpoint specifications, time studies, and share a pathologist’s use case. This workshop will conclude with a brief Q&A session.
-
- Hear from an expert pathologist on their experience with fully digital workflow and how they are teaming up with AI
-
- Learn more about several of Visiopharm’s Translational APPs, including technical, performance, and analytical validation details
-
- Experience a real-world use case for implementing AI-based pathologist support
Jeni Caldara, Technical Sales Specialist, Translational
Jeni Caldara is an innovative digital pathology professional that has spent the past 6 years specializing in AI-based image analysis and workflow implementation. With an education in cell biology, she enjoys generating creative AI solutions which highlight tissue-specific processes. Currently, Jeni is a Technical Sales Specialist at Visiopharm and is based out of the Colorado office, where she focuses on translational product offerings and incorporation into existing systems at user sites.
Dr Giovanni Lujan, Associate Director, Computational Pathology
Dr Lujan is an associate professor of pathology at the Ohio State University, College of Medicine, a clinical gastrointestinal pathologist and the associate director of Digital and computational pathology at the OSU Wexner Medical Center and OSU James Comprehensive Cancer Center. He is board certified in anatomic and clinical pathology with expertise in gastrointestinal pathology and over 15 years of experience in that field.
He completed a surgical pathology fellowship at The Johns Hopkins Medical Institution after graduating from the pathology residency program at The University of Texas Southwestern Medical Center. Dr Lujan has held previous academic appointments at The Johns Hopkins University School of Medicine and The University of Texas Southwestern Medical School.