Transcript
Hello, and thank you for coming today. We’re presenting for the STP conference. Our presentation entitled Advancing Image Analysis Capabilities to Enhance Drug Discovery.
I am Britt Boehmer and I’ll be joined by Brenna O’Neil as we conduct this Visiopharm presentation.
Certainly our approach to image analysis is to make that image analysis as easy as possible regardless of image modality, your analysis type and complexity, or the multitude of other factors that might influence image analysis.
Before we get started, I’d like to introduce Visioform in its most simplistic form.
We are a team of about one hundred employees, about half of which have advanced degrees and another half are supporting the software, whether that’s frontline application or software support or developing the next iteration of software so that you as a user can get the most out of it.
We’re well represented in the science having at least eight patents in our platform and we serve a majority of the big pharma in the industry.
We’re equally well represented in the scientific literature with over thirty five five thousand scientific publications.
At our heart, Visiopharm is a technology and artificial intelligence company.
Among the multitude of ready to use algorithms that we provide to all of our users, eight of which are CEIVD approved apps, which kind of sets the stage for where we’re headed in the US in regards to regulatory compliance and translational, deployment of algorithms.
One hundred percent of our software is rooted in AI, and we always strive to make more advancements on a regular basis so that you know that you’re working in the most contemporary software solution.
We’re also aligned with partners that you already know and trust in your laboratory environment, and we’re integrated with the majority of them. We are a vendor agnostic solution, and that goes to help aid a seamless workflow as you employ image analysis in your digital pathology workspace.
I wanna briefly introduce Visiopharm’s US field sales team and professional services team.
Of course, you’ve been introduced to myself and to Brenna, but we’re rounded out with Jenny Caldera, who is our diagnostic clinicals technical sales specialist, and Tony Cook, another account executive.
We’re led by Amanda Lau and James Nurbel.
I make these introductions in part because being a personal company is at the root, the heart of Visiopharm, and we believe in maintaining relationships first and foremost.
That extends to our approach to you as a client, and we have an entire team of professional service members that are dedicated to addressing your needs and supporting the VisioForm software and your application of it in a firsthand manner.
From Dan Horick, Jason Roberts, Michael Persch, Justin Major Major and Raymond Bradenburg, they’re all here based in the US and you can contact them personally and generally they’ll get back with you within a day or two in order to have a personal discussion about your needs and provide personalized support so that you can continue accessing your data in a contemporary manner.
Next, we need to address the reality of AI.
Deep learning, at its heart, isn’t magic, and automation doesn’t immediately result in augmentation.
Typically, when we think of artificial intelligence, specifically deep learning, we think of taking raw data that’s represented in in an image, throwing it in this magic hat we call AI, and out suddenly pops meaningful enriched data that describes exactly the biological solution we’re looking for.
In truth, the reality of AI is much more like this schematic, and Visiopharm’s goal is to simplify this process in order to have an augmented analysis at the end of it.
We start with annotations that enrich the raw data or image.
These annotations can come from machine learning classifiers or tools or from experts like pathologists or PI’s that have a biological understanding of the tissue.
From there, we use those annotations to train or refine a convolutional neural network, and we provide enhancements to that dataset with further annotations or corrections to enrich that raw data to a very detailed level.
Again, these enrichments and refinements can be done either using machine learning approaches or from a technical expert in that tissue.
And after an iterative approach to this, we end up with an algorithm that’s able to provide reliable results repeatedly across multiple batches of tissues and across multiple variations that we commonly see in those tissues.
In truth, all you really need to to have in order to use deep learning is an expert tissue knowledge. In other words, if you can see it and provide annotations, then you can train the automatic features and rules using a deep learning convolutional neural network, and then you can find it. In essence, classifying your tissue to identify those features of interest.
You really don’t need an in-depth knowledge of image analysis or programming in order to make this happen within the Visiopharm solution particularly.
You can also include and exclude different tissue types in your analysis and replace manual annotation steps in order to make this more functional or more realistic to your application.
And, ultimately, this will improve the consistency of your results, whether that’s across a single study or multiple studies.
At the start, we approach image analysis from the standpoint of regional segmentation and we see this as a strong value add in order to allow you to get more out of each individual data set We typically start this with tissue classification where we use our comprehensive, yet fully integrated AI toolbox to identify just the tissue on glass.
This allows us to reduce the amount of time and processing power wasted if we were to analyze background information rather than just the tissue exclusively.
From there, we would step into sub feature identification, such as the case I’ll be presenting next.
One important note is that all of the examples we’re providing today are actual client real world examples.
They’re not something from our warehouse of images, and we present them to show you the feasibility of doing these studies in your own environment.
Later in our conversation, we’ll talk about biomarker classifications in nuclear segments in a couple different ways so that you can see the context of these applied in multiple environments.
Getting back to our discussion of segmentation, provide a real world example about gastrointestinal IHC analysis where we were able to subcompartmentalize the mus muscularis, the submuscularis, the mucosa, the submucosa, and the villi in this GI tract tissue.
We can also use the deep learning algorithms in order to detect, for example, the lamina propria across multiple staining types. Here, we use a ABPAS and an H and E stained tissue section simultaneously so that one algorithm can do the work across both of those staining types.
Unlike the traditional approach that’s used when you’re actually coding some of these CNNs, VisioForm doesn’t require a massive amount of input from an annotation or machine learning standpoint in order to train a convolutional neural network.
Here you see a couple, exemplary training annotations that were used to train this specific client algorithm. Note that the amount of annotations is quite minimal, and frequently, I tell my clients to just annotate at the start three to five twenty x equivalent fields of view and then iteratively approach that adding another three to five small fields of view in order to mature the algorithm.
Using these annotation bases, you can then see how we’re able to go ahead and and then train one of these deep learning algorithms in the ABPIS stained tissue in order to identify these regions respectively.
The same algorithm performs optimally in the H and E tissues as well, where we’re able to identify the lamina propria in the H and E tissue equally Note that there is a great deal of sensitivity and we can be die we can be dynamic across magnification so that you have the accuracy and sensitivity that you’re needing when you approach these analytical, algorithms.
From there, once this is sub regionalized, we’re able to either compartmentalize, data analysis for features like nuclei or biomarker assessments in order to provide an informed assessment of those subregions.
But we don’t have to focus on those subregions, and instead, we could perform the analysis across the entire tissue. Either option is equally feasible, and metric based outputs can be easily easily obtained from the Visiopharm platform so that you have a comprehensive data output to describe the tissues you’re interested in evaluating.
This regional approach can also be done in many different contexts. Of course, Visiopharm is known for its outstanding work in the oncology field and one of the questions we are commonly asked is can we quickly identify tumor regions in my non tumor stained samples? And of course the answer is yes, where we would use a tumor segmentation algorithm to not only identify that tumor area in say a Ki-sixty seven ER or PR stained tissue, but we can also then quantify the tumor area quite sensitively for various biomarkers or for that region itself.
We can also do, analysis in the cytology field as one additional point. Here, we’re showing a Pap cell identification and classification, where we’re starting with the original image and applying our deep learning strategy in order to characterize the different types of populations we see in these pap cell, images.
The deep learning works kind of like a heat map where we’re identifying a high probability, in this case, red. Brenna will show you something in white lighter with a against a low probability of it being that feature. In this case, blue, or as Brenna will show you, in black in the future.
Using this deep learning based probability map, we’re then able to apply labels to those unique structures with a high degree of accuracy.
In essence, identifying the squamous cells, neutrophils, and clusters or any other sub regional compartmentalization you can imagine Next, we’ll get into biomarker assessments And this is highly important because most of the time, these biomarker assessments are really the necessary driver behind many of our analysis.
We’re commonly asked questions especially in the oncology space about, for example, PD L1 status in a lung cancer model.
And of course, we can assess not only the PD L1 status, but we can isolate that to the tumor region and output the number of PD L1 positive cells.
Certainly, we are an industry leader in nuclear assessments.
We can utilize our deep learning nuclei segmentation approach in order to not only identify the nuclei, but then compartmentalize those nuclei that are very close in proximity or potentially even overlapping.
You see here a couple examples in the IHC and HNE modalities, and Brandon will show you in a little bit more detail how we do this, common approach regardless of what modality it’s in, but she will focus in the immunofluorescent field.
But that’s not where it stop stops.
Going into the subnuclear or sub cytoplasmic or submembranous compartment, we’re able to even further mine data from these tissues as in the case of RNA scope analysis or ish type stains.
We can compartmentalize the nuclei, certainly, but then look at the probes in order to have a comprehensive understanding of cell or nuclear number, probe counts, and then classify the individual cells or nuclei based on the probe expression that occurs within them.
This allows you to have a comprehensive view of your tissue from the very macro to the very micro and get an informed metric based output to drive your decisions.
Next we’ll move into some comprehensive workflows as as provided by this NASH analytical workflow.
Certainly, we use the comprehensive AI toolbox to first do nuclear detection, and then as classically prescribed in the NASH workflow, we will exclude the capsule around these hepatic tissues in order to prevent any regional, stain gradient that might occur in that region.
From there, we do regional identification, pulling out the portal triads or other vasculature that might occur in these hepatic tissues. And then we can dive into evaluations like steatosis by looking at the hepatocyte lipid fraction, the inflammation, looking at the inflammatory foci density, or the ballooning cell density as well.
Each one of these can be assigned custom scores and we’ll dive into a little bit more detailed view here in just a second.
But also note that we can follow simultaneous, pathways for our analytical endpoints as indicated by this fibrosis workflow.
Note that the tissue detection and capsule inclusion as well as the regional identification are the same, but then we would carry a subsequent work path where we would identify the parenchyma of the PSR stained area in the vacuoles as our primary features, which then allows us to look at the PSR stain in order to identify bridging tissue, fibrotic cells, and perivascular, staining as well.
As with the other analyses in NASH or any other analyses for that matter, we can then use that data in order to come up with a customized scoring schema and classify your tissues as a whole.
Diving into the NASH analysis in a little bit more detail, we’re able to look at that hepatocyte lipid fraction and classify these dynamically as well as the ballooning cells and the inflammatory foci in order to come up with a steatosis and inflammatory score. We can also look at metrics like the inflammatory density or the foci density and have resulting scores from those.
As in the case with fibrosis analysis, we can be very granular in the, identification of the respective stains, in this case PSR, but it could also be the autofluorescence from PSR.
Using these very sensitive assessments, we’re able to then come up with periportal, perisinosoidal, or bridging fibrosis percentages, and then assign a custom scoring scheme. In this case, we’ve re represented the BRUNT score and score the entire tissue or parts of the tissue respectively.
I wanted to conclude our analysis discussion here with a very comprehensive workflow that’s done by one of our partners in the neurology space.
Here, they were looking at using the combination of an h and e image with an immunofluorescent image in order to maximize the quantitative capability of their assessments.
Initially, the h and e image was coregistered with an IF image in order to combine the information from those.
And the coregistration is highly accurate, almost down to the pixel level.
Then we created a deep learning algorithm to segment the regions of the brain within six seconds.
We follow that with a very accurate subcompartmental nuclear and astrocyte segmentation where we’re able to look at nuclei dynamically so that even those close in proximity or overlapping nuclei are accurately defined.
In a non traditional cell, like astrocytes, not only are we able to, accurately identify the entirety of the astrocyte and the potential branches or arms or projections of those astrocytes, but we can also do similar types of things like macrophages or lymphocytes.
From here, the subsequent analysis that isn’t shown is the resulting classification based on the multiple channel information we have from the immunofluorescent image.
The astrocytes were then classified relative to their proximity to an RFP, their colocalization with a nuclei indicating that they’re in a cell body, and then by size and shape resulting in twelve different classifications.
We do this by really expanding the integration between the modules and the different capabilities within the root platform.
At its heart, Visiopharm is an easy to use analytical toolbox for the range of image analysis problems.
In the Oncotopix Discovery platform, we have an easy to use toolbox for building algorithms across modality and file format and it has deep learning classifiers in the root of the platform.
All of the outputs are fully customizable, and I believe that there are currently about a hundred and fifty unique outputs, which can then be, expanded by doing custom in platform calculations and scoring schema.
We also have a comprehensive app center, which I actually prefer to call an inspiration library because you can look at how our experts develop their own algorithms, and you can learn from that to create highly specific algorithms specific to your endpoint.
From there, we use modules to extend the functionality, including a tissue array workflow that easily derays cores for individual analysis, a multiplex phenotyping workflow that Brenna will speak to in more detail here in a moment, a tissue aligned workflow that registers serial section or serial stained images even across modalities, and additional brain mapping tools using a prebuilt Atlas or more commonly a deep learning algorithm to identify and analyze brain regions.
At its heart, deep learning and artificial intelligence can be easy and it’s the foundation of Visiopharm’s platform.
Certainly, you can use one of our ready to use AI assisted apps to do image analysis and tissue mining like lameruli segmentation, node metastasis, tumor segmentation, and nuclei segmentation.
But what’s unique and very powerful about Visiopharm is that we allow you to have access to a unique author tool that you can use to build individually tailored solutions to your precise needs without needing any programming experience.
And as I’ve shown in this IHC image, annotating these can be as simple as tracing the feature that you’re interested in.
Visiopharm’s Tissue Align workflow is a simple workflow that’s wizard based and allows you to do multiple image alignment.
Initially, this started as a virtual multiplexing tool where we would take a pancytic keratin biomarker and align it or coregister a serial section with something that was stained for k I sixty seven, for example. And that would allow us to do evaluations, including the proliferative index of a tumor region.
But this has since grown into a coregistration and learning transfer tool where we’re able to coregister serial stains or serial image, sections across different modalities and then transfer the learning from one image to another image in order to maximize the amount of data from those respective images.
To set up BRENA’s conversational multiplex phenotyping, at its heart, it’s an automated, unbiased approach to Hyplex image analysis.
It starts much like our other workflows with tissue segmentation, advances to cell segmentation, and then ends with multiplex phenotyping as a comprehensive workflow.
It offers AI based cells classification and automatic phenotyping to meet all the different phenotyping approaches that’s common in the market today.
As with the entire platform, we can report a number of simple results like positive per cells or percentages.
We can do heat maps to display the density of any phenotype or biomarker for that matter. And we can also do object distances, universally across a platform so that you have a spatial approach to evaluating your datasets.
The one feature that is unique to multiplex phenotyping are the phenographs, which display clustering and exploratory phenotypic graphics for those multiplex phenotype datasets.
With that, I’m gonna hand it over to Brenna who’s gonna discuss the Visiopharm approach to multiplex phenotyping.
So Brit’s done a good job of introducing how Visiopharm works within our IHC and Brightfield platforms, and I wanted to take this opportunity to dive into our multiplex phenotyping module and how we can use that across fluorescent images.
So there’s some common challenges that users face when they’re analyzing multiplex images and determining the phenotypes.
Of course, to gain the maximum insights from your tissue data, you must begin with an instrument capable of producing a high resolution and full slide images upstream.
And I’ve got one example of such image here, below that you’ll also see throughout the image, throughout the PowerPoint.
This is a Acoia nineteen plex phenocycler fusion image and it’s with a DAPI stain for the nuclei and then a variety of other biomarkers.
So once you have these images and are ready to begin your subsequent analysis, users are then faced with the need to understand how deep learning AI works and when it’s going to be best applied.
Deep learning is the common approach that Visiopharm uses for segmentations of tissue compartments and other regions as well as our cell segmentation.
And cell segmentation is certainly a critical component, and the accuracy in this step is going to influence any phenotypic assessment later on.
After we discuss cell segmentation, we’ll dive into Visiopharm approach to multiplex phenotyping.
In an ideal situation, cellular phenotyping can be either manual or automated and it’s highly accurate and it can be used dynamically to define the range of expressions from broad assessments to those rare phenotype identifications or even evaluating targeted groups.
And finally, I’ll touch on the value of the integration within an image analysis platform which can maximize your information and the insights you may gain from the data embedded in your tissues.
Visiopharm software is also platform agnostic, so analysis can be performed across a multitude of imaging systems.
We have compatibility with Lunafor, IonPath, multiple La Coia systems, and Standard BioTools, which is formerly Fluidigm, as well as multiple other fluorescent scanner platforms.
And any of these images can then be moved into a customized multiplex analysis.
This is an overview of the multiplex phenotyping workflow, which we’ll break down together.
Again, we begin by discussing the use of deep learning to identify our tissue regions of interest for analysis.
We’ll touch on Visiopharm’s methods for accurate cell segmentation in the fluorescent space and then walk through the multiplex phenotyping analysis and understand the data interpretation tool that’s also natively available within the platform.
To answer our advanced research questions through phenotyping analysis, we must start with a strong foundation.
So, by defining regions and ourselves accurately, then we’ll be set up for success when we move into the multiplexing assessment.
After the tissue is identified, we then have the option to perform a regional segmentation.
So performing regional segmentation on our tissue is going to allow us to ask new questions regarding the details of even some challenging areas.
So, and again, example that I have here is that nineteen plexicoia image and this is, tonsil tissue and we’ve identified the germinal centers on the tonsil so we can further understand the cell populations that are going to live within.
Some of the other applications that we see are identification of tumor nests versus stromal regions and necrosis on the sample.
And you can further exclude regions from future analysis such as tissue folds, staining artifacts, or even vasculature.
It’s important to note that just because we’re performing regional compartmentalization, this doesn’t mean that we can only perform analysis by compartment.
Using the same subsequent algorithms, you can still assess populations both within and across compartments all at once.
A primary concern when building your strong foundation is an appropriate nuclear segmentation and the ability to expand the detection into the remaining fluorescent channels beyond.
We’re likely familiar with, nuclei detection shown here based on our nuclear channel like DAPI where we understand that the concept that each nuclei should contain DAPI regardless of other markers.
Now this is a great starting spot, but as you can see here, we then have to make some assumptions about where the nuclei boundary lies.
Sometimes we can struggle to identify where the nuclei end, so we like to identify information from other biomarkers.
By incorporating information from other nuclear channels such as Ki67 and RunX3 here, we can more precisely define the nuclear border.
The robustness of our nuclear segmentation in this way is unmatched in our field, and we’re really excited to show you some examples of this.
So let’s take a look at some of the nuclei, even in this small field of view shown here at the bottom, that could be challenging for some less robust algorithms.
We have the donut shape that we can see in the bottom left corner a few examples of those. These are often split, but here they’re captured properly.
There’s also differing shapes like elongated, small, large, round cells, and the segmentation handles each of these properly.
We also run into nuclei that appear in different planes of view, but again these are still robustly captured with our nuclear segmentation.
So, how are we going to achieve such robust results?
Our detection and segmentation is the leading algorithm for multiplex cell segmentation because we have expertly developed deep learning convolutional neural networks and they’re pre exposed to tissue specific morphology and trained to handle a wide degree of variation.
Cell identification and segmentation occurs using just one algorithm where three classes are defined to categorize pixels.
We have a nuclei class here shown in the top left, and this is a heat map of the deep learning algorithm where white are those areas most strongly identified as nuclei.
We have a background class shown in the middle and then a boundary class to the right and these black and white images above each are going to show that heat map.
Categorizing pixels into a nuclei or a background class allows us to differentiate true nuclear staining from what’s likely just noise and the ability to tease out the boundary of each individual cell allows for the most precise segmentation that’s currently available on the market.
Again, this all occurs in just one algorithm identifying these classes and performing segmentation in one step.
So we’ve discussed the need for a robust nuclear detection in your strong foundation, but the nucleus is just the first step for accurate biomarker assessment.
To best capture biomarkers expressed in the cytoplasm or the membrane, we must expand outside of the nucleus.
Now, traditionally, image analysis solutions have addressed this by expanding each detected DAPI nucleus, biocet distance, or number of pixels.
The drawback to this is that it fails to accurately follow the shape of a cell. So think of a macrophage versus a lymphocyte where macrophage have long arms versus the small cytoplasm in the lymphocyte.
Instead, Visiopharm offers you the ability to augment your nuclear detection with the cytoplasm and membrane expression that already exists within your image.
The ability to bring in these added biomarkers like CD thirty one, CD forty four, or PCNA shown here in heat maps is what makes us this what makes this the most accurate cell expansion where the detected boundaries follow those that you can visually see for the cell.
Below, we have our completed cell segmentation.
Visiopharm has published multiple on this method, and we’re currently working on further publishing this approach along with additional automation methods. And if you pay us a visit, we’re happy to share some of this information with you.
So we’ve built our strong foundation identifying regions of interest and accurately segmenting cells. Now we’re ready to step into our unbiased phenotyping.
This may be optimized on individual channels based on your biomarker panel, but the same base algorithm will be used every time.
While our primary approach here is an unsupervised multiplex analysis, Visiopharm’s platform also has the flexibility to approach phenotyping multiple ways.
A bioinformatics approach to phenotyping is possible where each cell is segmented, cell level data is obtained, and a bioinformatics platform then later determines the phenotypes.
Our unsupervised approach uses the cell outlines and defines cell populations automatically within them. And a supervised approach can also be used in smaller datasets where deep learning classifiers used to train for relevant phenotypes.
I’m going to step through the unsupervised process and also touch on some data interpretation tools that are available in the same platform.
We kick off the phenotyping by performing a channel optimization step. We want the optimization to be automated where, again, your only input is providing confirmation for what positives look like on single channels.
So for here on the Treg cell population and the CD4, CD8 example, we want you to confirm what we automatically find is positive.
Most freeware available for phenotyping utilizes the simplified clustering algorithms where a cluster defines a phenotype.
However, Visiopharm’s model uses a Gaussian distribution to define true positives where multiplex cells are defined a phenotype based on what you’ve confirmed as known true positives.
We take this approach because simple clustering algorithms often ignore or fail on phenotypes that are outliers or not part of the larger cluster.
We find it important to be able to capture these outliers as they may be rare phenotypes that are important to find in your research.
Through the use of proper cell segmentation, we also offer detailed control over biomarker bleed over that may occur. Our full toolbox allows you to have optimized positivity thresholding as well as control the percent of a cell that must meet that threshold.
So this prevents a cell experiencing bleed over from a neighboring cell to be called positive when not enough of that neighboring biomarker is present in the cell.
Following channel optimization, we’re ready to determine the present phenotypes.
Again, this could be occurring in specific regions or across the full tissue.
Now that you’ve optimized your biomarker channels, all cellular phenotypes expressing two or more biomarkers are automatically assessed according to your ground truth of the true positive assessment.
You may also further define the population labels used. For example, renaming a CDA positive cell found in your detected tumor nest region as a tumor infiltrating lymphocyte.
Again, all of these phenotypes have been detected using one app, which you can then use to answer multiple research analysis questions. Here, I have used the same algorithm to fit new endpoints. Our original algorithm was already optimized, so we simply select our phenotypes of interest.
Say you want to focus your interest on only five markers out of a nineteen marker panel and maybe focus your analysis into a Treg cell population.
This will yield a simplified yet targeted assessment. So So where we previously had two hundred and eleven unique phenotypes, here we’re down to a specific thirty phenotypes.
Now that we’ve performed our phenotyping, we need a set of robust data tools that help us assess the raw data in terms of biology, and we’re gonna step into these in more detail.
Within our native platform, Visiopharm offers one hundred and fifty unique metric based outputs.
When these outputs are combined with our custom scoring and calculation options, there’s practically endless possibilities for achievable endpoints.
Again, these calculations all take place within the platform, so you don’t necessarily have to do external calculations.
These outputs also include spatial metrics, such as cell to cell measurements and region or boundary based measurements as well.
Heat maps are also available for a quick visualization of where specific endpoints exist, and I have an example of this over on the right.
For example, I can create that density heat map to see where certain phenotypes of interest are clustered.
We’re also really excited to share our enhanced data exploration toolbox.
This toolbox exists still within the Visiopharm platform and offers both tSNE, or soon to be UMAP, and boxplotting options.
Within the tSNE or boxplots, you have the ability to select any of your specified output or endpoints for subsequent plotting.
We often see the box plot as a popular choice for nearest neighbor measurements.
These plots are also bidirectional, so as shown by the yellow squares on the images, if you select a point in the tSNE plot, then the associated cells will be highlighted on your image.
This bidirectionality is extremely important for looking at outliers or rare phenotypes, and you can select the outlier on the plot and jump to that exact cell within your image to study it.
So I’m going to turn it back over to Brett where he can describe some of our onboarding and support that comes post purchase.
Thank you, Brenna. It’s important as we consider different digital pathology analytical toolboxes to explore more than just the toolbox itself and also include conversations about the onboarding process and the support mechanisms that you can expect as you move into that platform and gain expertise.
At Videoform, we have several licensing module models in order to assist you in obtaining the model that works best for your environment.
In our case, we have perpetual models that allow unlimited volume with limited access or a subscription model paid annually with limited volume but unlimited access.
The important thing to note here is that both of these limitations are permanent are are not permanent and that you can modify both volume and access dynamically, but in a price model that fits your needs specifically.
You also wanna have a platform that’s built around you to ensure your continued success with the platform.
Visiopharm’s consultative support starts well before the purchase that you decide on.
But after the purchase process through order fulfillment, customer introductions, technical discussions, and even installation and deployment, we approach this in a consultative way so that you have a one on one engagement with experts either in the sales process or with the technical experts in Visiopharm to allow you to have the most comprehensive start that you need.
We further support this with onboarding training that can be done dynamically and to fit your needs in tangible work sessions so that you can get the most out of that onboarding experience.
The consultative support extends through your ongoing use, whether it’s week two of utilizing the platform or whether it’s year ten.
And for the most part, you can meet one on one with one of our technical experts within twenty four to forty eight hours for any level of support, whether that’s app based troubleshooting, workflow consultation, or a technical discussion.
Dan Horick is our customer success manager, and he’ll meet with you regularly throughout your usership to ensure that you’re getting the most out of the platform, to help you soundboard adjustments to the platform, or to put you in line with the experts that you need in order to make your usership easier and more robust.
We also have a number of advanced training options, including a base basic and advanced training academy to ensure that you’re using Visiopharm at the most expert level.
We also see that as a consultant in your digital pathology workflows that we help you to have a comprehensive approach towards your success.
Certainly, this begins with discussing your IT architecture, whether that’s system functionality, installation, and deployment support, but also advising you on your local infrastructure or your systems integration.
We see it as an example where the digital pathology analysis toolbox should fit into your environment and not the other way around.
To just highlight the training and platform support one more time, we do have an in person approach, but we also have onboarding training and training in multiple different platforms, whether that’s in person, remote, or online, so that you can utilize those tools dynamically and get the most out of them.
In addition to our advanced training opportunities, we also have a myriad of online resources and one of the most comprehensive help manuals available in the Digital Pathology field.
In terms of platform support, we offer troubleshooting assistance, app development help, and workflow optimization.
And one of the things that we’re really striving for with our current client base is to be involved in that pre analytical consultation.
We’re experts in this field certainly, and we can meet with you for a brief session in order to help optimize the entire process, whether that be app development, experimental design, or endpoint analysis.
Certainly, we’re leaders in the digital pathology field.
In addition to our expertise in digital pathology, Visiopharm hires scientific subject level experts like myself.
I spent multiple years as a PI in the fetal biology field.
And there are others experts like me who have been brought on by Visiopharm in order to meet with you at that high level and help you to get more out of your digital pathology workflows.
We’re also artificial intelligence authorities, and we’ve been in business for twenty or more years.
With that level of experience, we’ve seen the adoption of deep learning and multiple other approaches.
So you know that you’re partnered with an experienced expert in this field. Beyond that, it’s important that your post sale workflow and systems integration meets your current and future directions.
Visioform can be adapted to have flexibility in the workflows.
Certainly, when I was at the University of Colorado Anschutz Medical Campus as a first postdoc and then as a junior PI. I was driving both the experimental design, the acquisition of slides, and the analysis of slides. And then I would meet with a team of other researchers, my colleagues, in order to make interpretation of the data.
But this could also fit into a different type of workflow, whether that’s industry or academia, where the PI dictates to a technician what samples need to be processed and how they’re processed.
They would then go through acquisition and analysis in Visiopharm before being returned to the PI for sign off or data interpretation.
Likewise, as we’re seeing with the adoption of our translational workflows, a pathologist could also have input on this at this level where they would direct the acquisition and analysis. And when the analysis is returned, they’re given the aid of additional metric based data in order to make the call on a certain, or diagnosis on a certain slide or patient data.
It’s also important that this fits your existing infrastructure as in the case we describe here.
This is a real world example where we start with the digital pathology workflow in terms of tissue prep and slide prep. It then goes through a digitalization with the whole slide image scanning in addition to the whole logic workflow. And that goes into a digital archive file server which can be dynamically, integrated into either an image storage system or accessed through workflow servers of multiple endpoints.
In addition to being accessible through LISs or reporting solution servers or a lot of electronic medical records, of which we have multiple integrations across several of these different platforms. Visioform really is one of those inclusive toolboxes so that you can get more data as you step out into the endpoint workflow.
By adding this additional data, you can look at remote institutions or remote locations. You can apply that for informed analysis within your own institution at individual or other types of workstations, And it’s dynamically capable of working in the cloud so that you have integration across the AWS, Azure, or Google Clouds, but also with those tools that you use on a regular basis in both the research and clinical components.
To conclude our discussion today, I wanna talk about a few, applied applications when you’re using a digital, pathology workflow and what you can expect on the back end of that.
At my old institution, before I joined the Visiopharm team, we conducted a study where we looked at five different, sets of studies, images from studies, and we evaluated the efficiency of adopting a digital pathology workflow from a pre adoption to a post adoption standpoint.
In addition to some more difficult to objectify components like the addition of automated image analysis, the ability to have customizable applications, the ability to work remotely through networking, which was clearly important in the COVID era, and the ability to be adaptable and expandable as our volume or staffing requirements changed or the needs from other platform changed, we noticed three key areas of success.
One was a decrease in analytical time of up to ninety two percent.
This in itself is huge, but then when you compound that with an analytical area, enhancement of ninety four percent, this really is able to drive you into an a new level of efficiency.
Certainly, analytical area can be interpreted in multiple ways. In some cases, in our hands, it was moving from a field of view or point type of analysis to a whole slide image, which we found as a in a subsequent analysis, actually better represented the biology of those specific tissues. Again, remind yourself that we’re able to look at sub compartments or unique features for those exclusive analyses, but we can also describe the entire tissue as a whole.
This could also be implied in the terms of the throughput.
So now rather than doing just a few slides, you’re able to increase your slide volume drastically in order to enhance your abilities.
Interestingly, while we’re decreasing our analytical time and increasing the amount of area we’re able to analyze, we also saw a reduction in biomarker variation by twenty seven percent.
We came up with this calculation after evaluating using a gold standard of manual annotation and several other tools like the CellSense dimension platform from Olympus, Metamorph, and the Leica LASX platform in comparison with the adoption of Visiopharm and custom algorithms.
We were surprised by this because we didn’t think that we would see this type of dynamic approach across eight different biomarkers, yet we’re able to achieve a higher level of accuracy and precision in our assessments at the end of these studies.
As you may well know, Visiopharm is working with Ohio State University, and we’re happy to provide some preliminary data that will be reported in addition to several other abstracts at the DAPA conference coming up here later this year.
In this initial efficiency study looking at in the breast both the ER and the HER2 assessments as well as in the k I sixty seven assessment and the GI neuroendocrine tumor, we see that we’re able to influence the efficiency of analysis greatly in the endpoint, saving a lot of time in terms of this analytical capacity without sacrificing our sensitivity in the description of these biomarker assessments.
At the end of the day, you’re looking at a toolbox that should be able to help you get more out of each image without sacrificing any time, accuracy, and precision in your analysis.
With this, we wanna thank you for your time. We appreciate you listening. And if you have any questions, please feel free to contact myself or Brenna O’Neil at the emails listed below.
Have a great day.
Join Brit and Brenna from Visiopharm as they delve into our comprehensive AI toolbox for histopathology image assessment. They will begin by discussing the implementation of deep learning algorithms for maximizing data from multiplex phenotypic analysis. Discover how Visiopharm’s ease of use and robustness make it the ideal solution for even the toughest challenges.
-
- Simplifying deep learning algorithms for complex feature analysis
-
- Iterative approach to enhance the success of deep learning applications
-
- Maximizing workflow efficiency and accuracy through APP sequences and integrations
-
- Optimizing applications to tackle analytical challenges
-
- Providing platform-agnostic solutions for multiplex phenotyping data sets
-
- Practical benefits of using digital histopathology workflows
Brit Boehmer, Account Executive, Sales US, Visiopharm
Brit Boehmer is an Account Executive for the US West based in Denver, CO. He has a master’s and Ph.D. in physiology from Oklahoma State University and completed postdoctoral research in reproduction, nutrition and fetal growth. Brit joined Visiopharm in 2020 and supports clients with pre-sale APP development and advice on image analysis and histopathology workflows.
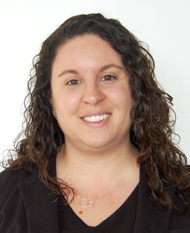
Brenna O’Neill, Technical Sales Specialist, Sales US, Visiopharm
Brenna O’Neill is the Technical Sales Specialist for the US West, based in Visiopharm’s Westminster, CO office. She has a master’s in ecology and over 10 years of imaging experience across multiple platforms, including 3 years in image analysis. As a Technical Sales Specialist, Brenna supports clients with software demonstrations and pre-sale APP development to address their image analysis needs.