Transcript
Afternoon, everyone, and thanks for joining us for our session. I think a few more people are walking in, but we’ll sort of kick start it slowly. And then we have some slides.
Well, so sorry if I feel a bit off. I just arrived from Denmark, to be honest, so I might be a bit jet lagged. At least I have no idea what time it is. So good morning, good afternoon, good evening, whatever it might be.
But thank you a lot for using your pre conference time with us. We really appreciate that and look forward to spending the next forty five, sixty minutes with you. So my name is Martin Christensen. I come from a company called, Visiopharm.
So we work with AI.
So as I said, I’ll be talking about staining consistency, and that’s very drastically different from slide quality. So I just want to clean that up already, that what we’re talking about here is your immunohistochemistry.
It’s your everyday lab work. We do use images, but we are not looking at the quality of the images here. We’re looking at the staining consistency.
So what I’ll be going through is trying to keep it low on the commercial side. I know I have a commercial role and come from a commercial company, but we actually do real science.
So what I wanna show you and take you through today is a product that we have developed, so the commercial part. But we’ve developed it for science, and we have done quite a few studies together with partners to investigate what is the impact of having tools like this and where would it fit in. So I’m hoping that I’ll take you through the reasoning behind this product at the same time as taking you through the science that we have done in developing it. So we’ll be showing you some examples from different labs.
We’ll be showing you some forced fail studies where we really try to see, can we mess up your staining protocols as much as possible, and how does that look like? And then we’ll, be taking you through a few last case studies before we enter into into a q and a session. So I promise there’ll be time to ask some questions about all of the different studies we’ve done. And, if you have any questions about stuff we haven’t shown you, you’re always more than welcome to come by.
But before I went too far in, I just wanted to share the vision that I think we all are, on the same page on, that there is a lot of changes going on in the field right now. And, actually, at our core, we do believe that we do the best we can in the medical field with the tools we have available.
It just so happens that those tools are changing, and I’m not gonna go through all of these individual tools. It’s just to showcase that there is a drastic development within the medical field in general and especially within oncology.
And it’s no surprise that as these tools are developing at a rapid pace, it’s difficult for us to tag along in what’s happening. And what I found a bit interesting preparing for this talk is looking at the complexity of the tools, or maybe actually the opposite, the simplicity of the tools. So if you had a cancer in the early nineteen hundreds, the solution is fairly simple. You cut away the part that’s cancerous, and then you hope for the best. And we know today that that probably won’t help in a lot of cases.
As we’ve progressed with radiotherapy and chemotherapy, we’ve learned that we can use other tools. But even these tools are now becoming more refined, more complex, and it requires more of us to know when to use them.
And to tie that into sort of a personal story, I was actually a victim of part of this. So three years ago, I got diagnosed with follicular lymphoma.
Treated now, so don’t worry about that.
But during that investigation of treatment, they basically told me, had you come in fifty years ago, we would have cut out that part of your neck that had tumor, and it wouldn’t have helped. You probably would have gotten it back. You would have died from it anyway.
Had you come in twenty years ago, we would have taken a giant cannon of a radio gun, and we would have pointed it at your entire body, bombarded you, and then hoped for the best.
With advances in radiotherapy, it actually meant that because of my mild version, which I’m lucky to have, they could do targeted, pinpointed treatments at a very small center of my neck, thirteen small doses, and it’s gone.
So there’s huge advances.
And I think it’s clear to all of us that when we look at pathology and the predictive markets that are there, they are becoming increasingly more important for us to select the right treatment for the right patient.
We are way beyond finding responders based on one biomarker. We are looking at levels of biomarkers and levels of multiple biomarkers to find that very personalized treatment that will help that almost individual patient.
That, of course, requires a lot of resources, it requires a lot of knowledge, and it requires a lot of precision.
And basically, all of those things are what we’re suffering from today.
We don’t have infinite resources. There’s just no way we can dream it up.
So we are too few pathologists.
There’s not enough any place in the world where you look, basically, except for Netherlands for some reason. As the test become more complex, those few pathologists that are there get pressured even more. There’s need for higher turnaround time as cancers evolve, and it has a real impact on treatment, and it has a real impact on financials and on patients.
But what we are often not talking so much about is actually all of that upstream work, because our pathologists are also challenged by the material they get in hand. You’ll often hear AI companies talk about if you want to use an algorithm, it’s not a magic toolbox. If you put crappy material in, you get a crappy answer out. But the same is actually true for pathologists.
If pathologists do not get proper material, they might get offset by that quality of that material.
So that’s where we’re focusing today on that twenty percent of the stain quality that we see being affected on a daily basis.
Now these studies are not conducted by us. They are conducted by external quality assessment teams such as the Nordic QC, who have done many, many runs with laboratories such as your own, assessing on different panels how their staining consistency is, and basically evaluating if they can perform as a laboratory or not. And they see a fairly consistent failure rate of about twenty percent.
Now, it’s important to note that that’s been dropping. Not many years ago, it was at thirty percent, so it is declining.
But it’s still fairly high. And regardless of what we want, we don’t have enough resources. So even the EQAs are challenged.
If they could, I’m sure that they would like to offer everyday controls, everyday assessments to help labs in improving their quality. But it’s simply not possible. Just like we have too few pathologists, we have too few assessors. So we don’t have the resources simply to be able to offer that insight.
That’s why we need new tools.
And if we look towards other areas of our laboratories, we’ve seen that they have managed to actually bring down their error rates. They’ve managed to work on controls. They’ve managed to reduce all of that that impacts the quality of the material that we look at. So one of the neighboring, departments is our clinical chemistry, where we’ve seen through the recent years that it decreases in their error rate quite drastically.
But despite of their decrease, the immunohistochemistry error rate is fairly consistent.
So there is true opportunity to improve. But, again, we don’t have infinite resources. We don’t have infinite manpower. We need to do something else. We need some new tools to help us cope with this.
And it’s not just us talking about it. I think the entire community agrees about it. And, very recently, there was a quite groundbreaking editorial, by doctor Taylor and doctor Manani talking about the need for standardizing immunohistochemistry beyond the level of personal preference and into the realm of being completely regulated, being able to be checked on, being able to be controlled by the likes of ISO or FDA.
So it is something that’s coming. It’s something that’s changing. But, again, because we don’t have infinite resources, we need to solve this with new tools.
So this is where we believe we’ve created a tool that can help cope with some of this. We’ve called it Qualitopix, but the tool is fairly simple. It’s meant to be an add on to your workflow and that, works in parallel. So, basically, it gives you the option to take standardized reference material, stain it in your lab, scan it, upload it into a platform that will analyze it, and then give you a response back.
So based on the dashboard, you can basically see for each marker, each clone, what is your performance. And you are able to address exactly those pain points that are off, And you can do this as many times as you want because it’s not a human being sitting at the other end. It’s a computer.
So it really gives you that opportunity for high throughput monitoring. And, of course, you can deep dive in any aspects of this. So you can jump into a service such as PDL one, and you can look at the variation from day to day or from test to test. So you can track that evenness of your performance.
You can even set up boundaries so you can get warnings if it drops too far out of performance. A little variation is natural, so you can’t control everything. But it can give you those warnings, and it can flag them with attention needing samples. So it really directs your attention to where you have issues and not on everything in the lab.
And once you do explore an issue, you are able to visually compare different stains of your own. So you can look at different time points, look at what the difference may be. You can split up the results by stainers, by scanners, by basically any instrument or any metadata that you’ve entered into the platform. So it really is that all monitoring tool that you can use to try to troubleshoot your laboratory and figure out where did something change, what happened.
I think for many of us, it’s not the lack of will to wanting to increase our quality. It is the lack of resources and possibilities. And this is what we try to give to this with this tool. It’s simply one of those possibilities.
So today, we’ve tested this platform on quite a few different hospitals, quite a few different biomarkers. So here’s a short list of the ones we’ve already been working on, and we’re adding more ongoingly.
And we find that the same tool is applicable for many of these markers. So we’ll keep on expanding as long as it makes sense to offer these these kind of control tissues. And you’ll also notice that amount of controls that we offer, so across cell lines, speeds, normal human tissue, is also increasing. So we really try to cope for all of those different variations.
And what we’re looking for is basically different sources of error that will be able to help you improve that laboratory workflow. So this might be caused by global issues, something that’s affecting all systems in your laboratory. Could be staffing, such as operators.
It could be a change in shift, so one group of people operating the instruments in a different way. It could also be more generic, such as power supply, which I’ll show you an example of later. Or it could be sectioning thickness that affects your laboratory.
But there’s also some instrument specific ones. This is where you’d have to call a technician to fix a vortex, uneven leveling, clogged drain, something like that. And then within the individual instruments, there’s also issues that you might not, detect every day. That’s got to do with heating pads, uneven leveling of the individual trays, and and other internal problems in the staining machines.
One of the first things we did was to look at what kind of material can we use to actually get insight into what’s going on. We know today that a lot of people, a lot of labs, use positive and negative controls selected from human tissue. It’s easy to source. In most labs, it’s within the hospital, so you can gather that tissue on an ongoing basis. And also EQAs have created schemes that allow you to select that tissue properly depending on what marker you’re looking for, so you get the responses and you know what to test for.
And in many of these cases, you would include tonsil as part of that normal control.
To be honest, we struggled a lot with tonsil tissue. From an AI perspective, you can analyze it, but, you need to select certain areas. You need to be a variation. So there was a lot of things that made it difficult. So we really wanted to see, can we go somewhere else to find material that’s easier to handle? So we started out with cell lines, and, we went into a project together with, University of Munich Medical Center Utrecht in the Netherlands, Iowa State University, and Array Science. And we created a study protocol where, basically, we’re changing many parameters at the same time, and we’re trying to monitor what is the impact of that change of parameter.
So we made, two series where we varied the retrieval buffer pH from low to high. We changed the incubation time from fifteen to thirty minutes. We changed the antibody dilution from one to one, one to two, and so on. And then we took all of these combinations of studies, and we repeated them six times to make sure that we had a statistical amount of data that could give us indications of what material can give you a baseline for investigating your lab.
And all of these samples, we compared to a reference breast cancer case.
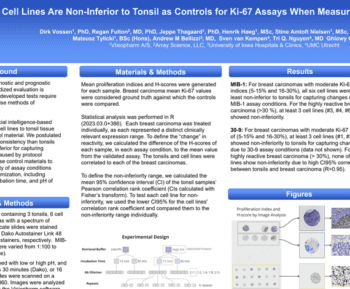
So, what we came up with, as you can see, the black lines on both sides of the slide here, is the reference breast cancer case. So this is the ideal.
This is what we would expect that our reference material could emulate. Not so much lie on the same line, but have that same form, that same variation, because that tells us that we can use our reference material to make predictions about how our patient material will react.
Now, what you see on the left side here is the tonsil material. So all of the slightly purple or varying degrees of purple, that’s the tonsil. And what you see on the right side is, on the green bars, it’s all of the cell lines. And, for each of the lines, it’s a different variation of our study protocol.
And it’s not that difficult to see from the naked eye how much variation there is in the SUNTOL and how little it actually correlates with the breast cancer material.
So it’s quite difficult, actually, to use human tonsil material to evaluate whether your protocols are affecting your, patient material.
On the other hand, cell lines fit quite nicely. So it definitely indicates that reference material, standardized and designed to have a certain amount of biomarker expression is suitable to make a quality assessment of your protocols.
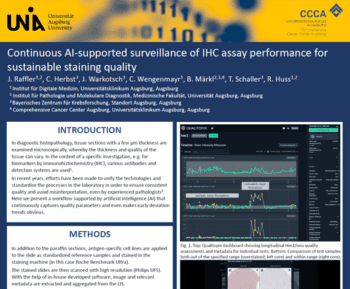
But, of course, that’s not the only type of reference material there is. We’ve been looking at beads. So basically glass beads coated with a known concentration of alolite.
The interesting part about beads is that you can produce them in vast amounts. You don’t have to design them genetically. You don’t have to grow them. It it’s a much easier process to make this reference material.
And on top of that, you can very nicely control the amount of analyte. So if you see on that small picture, you’ll notice that there’s a number of, see if I can hit. There’s a number of positively stained beads. There’s a number of beads that are not stained. And then there’s some small, beads that are working as negative controls that should never be resectable for any staining. So it’s quite easy to control how much you put on each individual bead, and it’s quite easy to control how many beads you put in that sample. So apart from just working as a reference material, it’s also very suitable for calibrators, being able to calibrate your system to the lower limit of detection, to the lowest limit of which you can observe and see biomarkers.
And that becomes extremely important when we talk about the new regimes of low. We have HER2 low. I’ve heard rumors of HER2 ultra low. So all of these minor cutoffs are on a continuous scale that’s really difficult to evaluate, really requires that you have control of your quality.
If you play with the example that you induce a twenty percent variation in any patient sample, and you try to detect if it’s low or ultra low, that’s an extremely hard case to know if it comes from variation or it comes from the actual patient.
And we’ve also been looking at other reference materials. So if I may point your attention to two of the people sitting, slightly further back from, collaborating group in in Leeds, NPIC. They, by the way, have a few talks throughout this conference, so I can recommend you to drop by those. They are extremely interesting. But they have developed a new biopolymer to work as a control for h and e staining. Of course, we’ve developed AI on top of that to look at that biopolymer. But it basically enables lab to quantitatively look at the h and e staining and look at the variation.
Now why do we wanna do that? We know that there’s a lot of variation in h and e already, but I’ll show you in just a little bit why that’s important. And as we walk into the new era of AI, again, coming from an AI company, I will tell you that it’s not a magic toolbox. It can’t solve everything. So if you wanna use AI in H and E, it does require you to implement a certain level of standardization.
But how on earth do you do that without controlling your variability? So this is a key tool to do that.
And what we’ve been able to show with this biopolymer is that we can actually measure individual levels of hematoxylin and eosin from those images that I showed you before.
So we are able to split it up and look at each individual component. We can quantify same day variation, which is what you see in the, dotted lines in the dots above each other. And we can quantify when you have system drifts. We can quantify when you have so much variation that you deviate from your normal production. So basically, you can get a very deep insight into your laboratory performance, and you’ll be able to figure out what kind of changes will impact your staining in a positive and negative way.
So needless to say, we’re not stopping there. We’re doing a lot to try and to link different outliers to different root causes. We have gathered a lot of data, and we’re now looking at where does this all come from. So what I’ve listed here is just some of the root causes we have connected so far through our system.
So again, if you have a failure within Qualitopix, it’s related to one of these that we’ve tested. There might be some root cause failures that you’re aware of that’s not on the list. Fair. Do come by and let us know because we’re constantly trying to test for new.
One of the easier examples that we’ve seen, and we actually saw this quite recently in Denmark, they’ve had really high performance. So they’ve had quite even production, very nice stable production with minor changes. But all of a sudden, they saw a spike in their reaction pattern, both on their on their normal tissue and their patients and also on the control material.
And they thought this was quite weird because all of a sudden, negative control material, negative patients became positive.
So it’s actually a huge risk, if you’re not aware of this, to overtreat your patients.
So after looking into the different data points that they had entered into our system, it turned out that this was tightly linked into a reactant lot change. So from one reactant lot to another, there was a control issue at the production facility that basically meant that it would over amplify your samples.
Changing a lot immediately normalized the production of the labs.
They could go back to the other labs that they work with that they knew got reagent material reagents from the same vendor, And we’re able to prevent that that happened in those labs as well.
But as I said, it’s not just a matter of what reagent, what clone you use. Within the instruments themselves, there’s a huge impact.
So you’re probably all aware that there’s positional differences within the staining machines.
And even in some reagents or some, markers, they are approved for certain positions within these machines. So we know that in some cases, this happens. But despite of that, I still wanted to point you at at this graph here where we’ve done a single run of HER2 within one staining machine, and we’ll look at the variation of all of these individual positions within the stainer. So if you look at a position like number twenty one versus the twenty two, there’s a huge difference. And that will directly impact your patient material as well.
Here, it turned out nothing to do with the staph, nothing to do with the antibody, the reagent lot, anything, purely due to the machine itself, to heating pads that were not working, and to a physical damage on the drawer.
So you might not be aware of this because it doesn’t look odd. You’ll still have positive and negative controls. But if you look at those intermediate controls and you look at the absolute value of each of those controls throughout every position, you’ll start to see these variations.
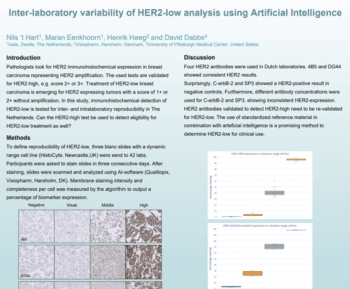
And, of course, this is a nice uneven pattern. Right? So anyone can see that there’s something wrong, but it might also be a bit more subtle. So here we have a similar setup with a single run of PDL one where you notice that there’s a staining drop in position twenty one to twenty nine.
So this is uneven leveling. The the whole instrument is simply not leveled. They need to fix it. And they went back and and fixed some of the slide racks as well. And the odd thing about it is if you look at the last position, position number thirty, it’s much more comparable to the other positions in the machine.
And just to give you a visual understanding of how does this then look like in the real life, we’ve taken out sample thirty, so the last one, and sample twenty eight. And you can visually see the difference in these two samples. So there is something clearly wrong.
With the tool, you can document it. You can document, your changes, your corrections, and you can put it into your logs to showcase that you fixed this issue.
But the issues might be even more subtle than uneven leveling. We experienced this at a few different sites looking at HER2 and ER data. The example that I’m showing here is from a run of a ER stainer. But basically, all of a sudden, the positive and intermediate controls dropped. We thought initially that this is due to the material simply dropping off the slide, disappearing completely.
But after looking at the material, looking at the images, that those material were still there. And then deep diving into the instruments, it turns out that this was actually due to crystallization buildup. So the nozzle was being blocked. And as soon as that crystallization was removed, the production resumed back to normal, and it evened out.
So even when you have a really good lab, when you have extremely high standards, you might get hit by some of these issues. And how fast do you get time to react with them? With tools like this, you get a warning, and you’ll be able to fix it the same day.
And it does have a huge difference how much you clean your instruments, how much you maintain them. If you look at these two bar graphs, this is different positions within a single stainer, where we’ve only looked at an intermediate core. We’ve looked at the staining variation from each position before we’ve cleaned it, the light purple, and after we’ve cleaned the instruments, the dark purple.
And just look at the stability you can get across the positions just by maintaining and cleaning it. But when do you do that maintenance? When do you do that cleaning? Do you do it fixed every three months, every six months, every year? Or do you do it when there’s an issue that arises?
It’s really difficult to find out when those issues arise unless you have something quantitative to look at.
So one of the other things we have looked at together with, one of our other collaborators, Nordic QC, is more of a systemic error. So if we look beyond the staining machines, if we look towards the sectioning benches, we all know that there’s variation from lap to lap and how thick these sections are. With some of the new machines that are out there that can automatically section your slides, Those sectional thickness are becoming more, normal or more standardized.
But we’ve looked at how big of an impact does it actually have on your images. So in this case, we work together, as I said, with Nordic QC. We use the same ready to use kit from OptiView, and we stain four different runs of material.
And we sectioned the slides at different thicknesses from one microns to three microns onto five microns.
And then we measured, compared to an optimal protocol, what is the difference in terms of increased sensitivity or increased expression of biomarker and decreased expression of biomarker.
And we actually get a quite clear signal that if you look at the reference, the recommended protocol, you get a very nice, even performance. But as soon as you start to make thicker thicknesses, you actually get an increased signal that will offset your reading. And as soon as you make thinner thicknesses, you will get weaker signal that will also offset your reading.
As a byproduct, what we also found is that if this is humans looking at the control material, trying to evaluate if there’s an impact on your staining or not, they will detect eighty five percent of the cases where there is an impact caused by dissection and thickness.
Using AI and humans, we increased that to ninety six percent.
So there is a much higher sensitivity in using automated tools and using control material that can help you figure out if you are varying away from your standards.
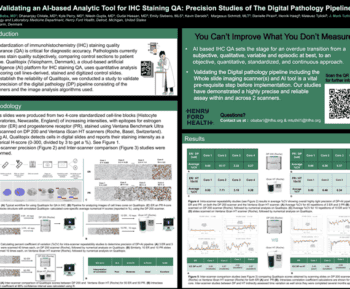
On another case, we’ve looked towards HER2 clones. We’ve looked across vendors to try to figure out, is there a difference in the different clones that you look at? Some of the most used clones, like the HSEP test and the four b five, have a relatively high score when we look at the EQAs, whereas, some of the less used clones, like the ten a seven, has a significantly lower score when we look at the EQAs. So we wanted to see if we could replicate that in sensitivity towards the HER2 clones. And, we could. And, basically, when we look at the lower scoring course using cell line material, we could see that there’s more or less no reaction in any of the negative intermediate controls.
The only reaction that you spot is when you look at the high control. So you could also say if you are in a lab where you don’t use intermediate controls, where you only use a low and a high, you might miss out on this stuff because there is a reaction. It’s just nowhere near the levels of what you would see of other reagents. So the sensitivity is just not there for the ten a seven, especially not compared to the other biomarkers.
And these issues that are global, they might be even more weird and and completely unrelated to the biology and the science. This is actually a quite interesting case that was conducted by Stanford University and the Boston cell standards that we referred to before, where they, on a routine basis, were staining for alc. So they have multiple outruns where they’ve been looking at the intensity, and they have experienced that they have a generally low intensity of the staining for all of their outruns. And they found that quite weird because when you look at these stains, you like that high dynamic range. You really want something that has a high expression and something that has a low and a lot of variability in between, but it just wasn’t there when they were looking at their runs.
After an extensive root cause analysis, they found out that this was due to electrical power interruption.
And they implemented UPMs, UPSs as it also may be called, to stabilize that power surge that really changed the performance of the machines. And after doing that, they achieved a much bigger dynamic range of the entire laboratory performance. They were able to see many more variations in their ALK staining and, generally, a very simple solution to improve their quality.
So at least one takeaway, if you’re not sure if you have UPMs or UPSs, maybe go back to your lab and check if they’re there. If not, do yourself the favor of making sure they’re on each machine or in the hospital.
So, really, what I hope we’ve shown you is that there’s a lot of error sources. There’s a lot of potential root causes. There’s too many for you to be able to check all of them, for any person to check all of them. But there’s a dire need to control your administered chemistry staining. There’s a dire need to calibrate and continuously monitor it.
Even when you are a well performing lab, you need to continuously monitor it because you never know when that day may come, where there’s a clock drain, where there is crystallization, where that odd thing occurs that doesn’t occur all the time. So you need to ongoingly identify the variations that you see because you also don’t know if it’s due to your own laboratory or if it’s due to the vendors that deliver an off batch that you need to check for.
And if we look beyond your own lab, just looking at the materials you use, there’s a huge difference in which controls you use, if you use positive and negative controls, or if you have intermediate controls.
I don’t think I’m the only one that says that you need to have intermediate samples to be able to increase your sensitivity and be able to get insight on your variation. And you also do need to make sure that you don’t necessarily choose the cheapest clone. Choose it if it works, but make sure to make clone selections that support your lab and support your patients.
So control your selection, control your setup, and control what you want to look for. And then again, a potentially easy fix is to make sure that you control your power sources That, if nothing else, is a fairly low cost cheap solution.
And then as you leave here, I really do hope that you consider, maybe some of the business cases behind it. A lot of the arguments that you might be sitting there wondering is, well, it’s easy, it’s cheap, it’s free of charge for us to acquire human patient material. So there’s no reason to go away from human control material other than the fact that it’s not as sensitive as the design material. But I really do hope you would consider the the human time that’s needed in acquiring human tissue. Your laboratory staff will need substantial amount of time to find, quantify, and investigate that material that you find and you dig out. So maybe it’s actually cheaper to buy a commercially available product.
And then if you are working out of this room, considering to use AI tools to improve your diagnostic decision support, let it be H and E, immunoscedochemistry, do consider if you think that’s a magic box to solve some of your core issues or if there’s actually something you can do upstream in your pre analytical work that can assure that that AI tool you acquire for a lot of money, let’s just be honest, will have the highest impact on your lab and is not susceptible to errors that you could avoid.
So with that, I think I’ll I’ll end in open for a range of questions and discussions and just by saying that consistency is not something we achieve once. Quality is not something we achieve once.
All of it is constant work. It’s constant monitoring, and it’s a constant effort. It’s not easy, but it sure is needed.
Thank you for your time.
Thanks for the really interesting and informative talk. I think if you look at the evolution of this field, we’re asking now AI algorithms to interpret slides that have been subject to a variety of staining protocols, variable pre analytical conditions, as you mentioned. And I think the goal of standardizing that, being able to detect that monitor lab quality is laudable. I’d like you to comment if you can on whether you think the AI will eventually compensate for all of these variations to give the same ultimate answer or whether that won’t be possible until we standardize these procedures more. You can’t see what you can’t see.
I think that’s a core issue.
Just like we don’t know what we don’t know. So if what we’re looking at, if we assume that that’s perfect and we read it under consensus that that is as it should be, then we might make the interpretations that this is a positive or negative or a score of thirty or fifty or whatever it might be. And that holds true whether it’s an AI or it’s a pathologist.
Might sound controversial representing an AI company, but a lot of us use pathology readings as the golden standard to develop our AI from. So to some extent, AI is not necessarily cleverer than all of us, but is able to perform the same operations again and again and again with the same up with the same standards without getting tired.
So if we do not control that variability, AI has risk of failing just as much as humans.
They’ll just do it more consistently.
I hope that answered.
Questions around the cell blocks were formal and fixed, I assume. And then, you know, how we we we always should have the tissue processed the same way within the laboratory. Have you did you see any variability with that?
You’re thinking about speed of fixation from operation table?
Processing it the same way versus, you know, like, on on those cell lines, a lot of times, it’s something that’s like a companion diagnostic test. So that’s been already vetted out in the validation, but for just the mainstream laboratories.
Yeah. Well, you’re completely right. There’s a hole in the cell material, right, in the in the reference material because it doesn’t capture all of what happens from it’s taken out of the patient until it’s put under the microscope.
So what we’re looking at here is pure analytical variation. It’s pure due to section thickness, pure due to stainless.
So you’re completely right. There is variation there. And I know there has been, quite a few studies looking, on the time from operation to fixation, even looking at fixating with vacuum to make sure that you stop the biological process faster, and it has a high impact as well. We have cut the answer short.
We have looked at it, yes, but we don’t have real big studies. We don’t have definitive answers. We know it has impact, but what we know is that this has a huge impact as well. So let’s solve this one first, and then we’ll take the other one next.
I’m Yosef Jeong. I’m, I’m a pathology stem also working on, quality assurance program in Korea. And actually, your approach, your, the studies then to to give some reference, that, about the idea that how we can enhance how we can improve our staining quality is very impressive. But, I saw that, you know, after Chat GPT, we saw a lot of generative AI.
Last week I was in MacKay and I found a lot of generative AI related to the pathology data. So, so we’re trying to generate images to compensate some errors and some imperfections. So like in this perspective, I think, I’m also trying to initiate one of the projects that is the ability to generative AI to make some like when we have a folder that with some unnecessary people in the background, we want to delete it by some AI algorithm or something right now.
So how I think it’ll be better solution, it’ll be, better opportunity for us to use like like to use, this generative AI, to improve image quality?
How do you think about this?
So if I sum it up and make sure I get the question. So how we use generative AI to improve image quality? Is that basically yeah.
First of all, it might be me that’s weird, but ChatGPT and all of these tools, big fan of them, but I have a tendency that every time they’ve helped me or I’ve asked them for advice, I I type back, thanks for your help.
I don’t know if I’m scared that they’ll take over the world at some point, but I feel that they have personality. Right? We need to treat them properly.
So it already has an impact in many different levels. I think a lot of the generative AI tools we’ve seen so far are around language. It’s around image creation. We’ve even worked on some of them self creating, you could say, fake or enriched data. A lot of what we do when we develop and test, not so much these protocols, but more decision support is to create artificial noise. So actually do it the other way around, add more variability, add more twists, add more variations to enrich the data sets.
I do think that there is hope that AI will get more powerful. I also do think there’s caution we need to take.
What is strong right now with AI is repeatability.
It’s consistency.
If you look at a patient, you wanna make sure that you look at this patient the same way as the next patient and you have that even treatment that we know works.
So it’s the balance of having AI that you teach how to adapt itself, but also pause it and say, okay. Now we understand you. We know how you works. We know you’re consistent.
We know that you can pull the same as one, two, three, five pathologist in consensus. We have that evidence. Now you’re locked down and you do not change. You repeat the task going on here.
That’s my belief. I might be off. I I do think it’s slightly dangerous to open the realm too much to AI that can control everything unless we remember to say thank you.
Yeah.
I have a question here, for so, you know, variability is a common thing in the in the lab, and even the scanner difference that generates a lot of variability, not talking about the stains. Stings are much much wider, spectrum of variability. Now the question is, you can collect a lot of datas. In fact, we have some datas in our own lab. How do you define the variability is beyond your standard, and how can you calculate out? So if you say, okay. Three, you know, standard deviation, because now you have a number.
Is that truly Westgard, you know, Lou will work in this scenario?
So, again, let me just make sure. So how do we look at the scanner quality? Is that the yeah. And what I think there was two questions there. Right?
So scanner quality impact scan Not only, like, a scan quality.
It’s just in general, all the variabilities that you can generate through your collection data. And then you have to decide, you know, I mean, what is the allowable variability?
Yeah. And and also what you design your your level of, of performance against.
In some cases, it’s it’s personal preference.
We have a we all know those labs, right, where they would like a more intense background staining. They like the hematoxylin to be very clear, so you can see the blue in the nuclei pop out of their eyes.
So we all know that. I do think the work of Taylor and is hugely important because it calls for this standardization across the industry, not just looking at individual preferences.
And then towards the scanner question, we do record scanners in the tool. So we can actually split the data based on stainers. We can split it based on scanners. And as you said, there is scanner to scanner variation. But I also know there’s a lot of work in trying to standardize that.
So there’s work in terms of making sure that they are calibrated to reproduce colors, reproduce sizes.
And I do have faith that that will happen within the scanning industry without necessarily having to, you could say, alter the data, alter the images. And I think that’s where we bridge into some of the the slightly more dangerous part of AI manipulation.
At least if you look towards Instagram and all of those social media, everyone looks so slim and pretty, and I’m definitely not that form. Right? What if you apply the same to medical data, to performatory data, and said, this does not look like, it it’s perfect. Let’s adjust it. Let’s adjust the raw data so it looks as I expect. Who says it’s not supposed to look like that, and we’re actually looking at something that’s deceased?
So manipulating too much with raw data, I find, is dangerous. Solving it at the root, I find, is much more stable.
There was a yeah.
So, do these different sorts of, variations in your examples have unique patterns?
And if so, can we have a system to point to the root cause of the problem rather than just flagging and asking the user to figure out what the source is to fix it? And the second question is when you say, the performance drops and, for example, you use intensity as the metric drops from normal, what is normal?
Is there any defined baseline for it?
Yeah. So, maybe a slight correction. It’s, it’s not intensity. It’s something called h score. So it’s a combination of intensity and percentage ranges in different samples. It’s it’s it’s more of a scoring system than it’s an actual intensity.
But it all relates to a full dynamic range, so we we do know how dark, dark brown looks like.
There is not an absolute standard yet. We’ve been trying to look at what should an absolute standard be. What should the best performance for b five or HACCP test or whatever market be how should it look like?
We can’t, and we can’t set it alone. That’s why we’re working with the UKNECWCs and the Nordic QCs, DQAs, to try to figure out what is it, what is normal. And it will be different from clone to clone.
There is an approved reaction pattern of the HSEP test, and there’s approved reaction pattern of the 4v5. And they’re not similar.
So there will be local variations, local changes you need to make depending on which which antibody you’ve chosen.
So we don’t have absolute levels yet. Where we’ve more worked on is absolute levels of change. So the difference of two standard deviations. So basically making sure you’re consistent.
And then there was another question that I think I’ve slightly forgotten.
The root courses. Yeah. Exactly.
Right now, we’re at the stage where we’re recording data, going back to the generative AI tool. We’re we’re just putting as much data into it to record it and also the root causes. So as an issue is resolved, the reason why it was, appeared in the first time, it will be there. So with with time, we hope that we’ll be able to build that guidance and say, we’ve seen this artifact before. Go look at these three things, the likelihood of being a clogged drain is this, the likelihood of uneven leveling is this, to give that guidance and make that troubleshooting, faster. We’re not quite there yet.
A week or two.
And the microphone disappeared to somewhere there. Okay.
So, Martin, very interesting talk.
Talking about solving the problem at the root, you and I have talked in the past. We we all believe in that. So So do you know if any labs use spectrometers, calibrated spectrometers, to do all this work to locate, you know, how their patterns are changing over time with with each of these? Because the moment you add scanners into this, you’re making images. And I don’t know if you noticed, but the two screens were showing significantly different colors. Yeah.
And so that’s a fundamental problem that you have, you know, completely muxed up the whole thing. Right? So do labs use spectrometers to do this kind of work?
Yes.
Short answer is yes. Labs use it. Right now, we have forty, fifty labs that use it in daily routine practice. We have some that are considering to go to every test, which is a lot.
So it’s being used, which is where we have a lot of the data from.
So there there is differences, and there is differences across the different scanners. We make all of those variations. So we’ve we’ve trained the AI to take into account some of that. So we are not at the point where we’re changing the the performance of the individual lab to unify them across the labs. We are more at the point where we are making sure that they do the same today as they do tomorrow and the next day. So that unification, you could say. Consistency.
I hope that answers it.
Any other questions, comments, thoughts?
No?
Well, in that case, I think, I’m close to being the only one that stands between you and, and that drinks reception. So, maybe I’ll let you go a few minutes early and just say thank you for your time. And if you do come up with any questions throughout the week, we’re here, the entire show. So just come by our booth, and we’d be happy to talk. Thank you for your time.
Tissue staining is a critical step in the diagnosis and prognosis of various diseases, especially cancer. However, tissue staining quality can vary significantly due to factors such as reagents, protocols, instruments, even operators. This can lead to inconsistent and inaccurate results, affecting patient care and clinical research.
In this seminar presented at PathVisions 2023, Martin will discuss challenges for managing stain quality of immunohistochemical (IHC) and H&E, potential root causes and a practical QA/QC solution. Qualitopix uses artificial intelligence (AI) to analyze standardized, validated test materials over time, complementing external quality assessment (EQA)-led proficiency testing. He will go through real-world examples and research conducted through the last 12-18 months.
- Importance of Staining Consistency: One of the main takeaways is the critical role that staining consistency plays in accurate diagnostics. Ensuring consistency is vital for reliable test results in immunohistochemistry.
- Role of Technology and AI: The seminar highlighted how advancements in AI and the development of new tools can significantly aid in monitoring and improving staining quality, thereby enhancing the overall diagnostic process.
- Need for Standardization and Quality Control: The talk emphasized the need for standardization in staining procedures and the use of quality control measures. This is essential to cope with the challenges posed by the complexity and variability of tests in pathology labs.
Martin Kristensson
Senior Vice President, Global Clinical Sales