Transcript
Hello, everybody. Welcome back to our master class series on the challenges of IHC staining. I’m Bettina Winkler from Visiopharm. And today, we are having the third edition with our own chief diagnostic officer, Dirk Fossen.
Dirk will introduce Qualitopix, Visiopharm’s solution to monitor and document your staining consistency.
Dirk has a track record of creating value through innovation in digital and computational pathology.
His experience spans the entire range of development from ideation through validation and certification of medical devices.
Handing over to Dirk to start the webinar.
Thank you for your kind introduction, Bettina.
In this presentation, I’ll be introducing Qualitopix, Visiopharm’s tool for monitoring stain consistency.
I’ll start with reviewing the problem of staining consistency.
Throughout the pathology workflow, standardization remains a challenge.
Tissue that’s taken in a biopsy is subsequently fixated and embedded, sectioned, and stained in the pathology map. Finally, a pathologist makes an interpretation based on that slide.
In this presentation, I’ll be focusing on staining and more specifically IHC staining.
Results of EQAs, external quality assessment schemes, show over many, many years and hundreds of labs that about twenty percent of labs participating fail in staining proficiency testing.
Those twenty percent typically have false positive cases and most of the time false negative cases.
Those errors and insufficient staining leads to increased healthcare costs and maybe more important delayed treatments or potentially the role treatment.
Let’s look at the potential root causes of analytical error in IHC.
Other techniques in clinical chemistry, hematology, and other areas have much lower than analytical error rates compared to IHC.
The graph on the right shows that the error rate in IHC has been stable over the last decades, while in clinical chemistry, it has dropped significantly orders of magnitude.
Potential root causes for this includes, but are not limited to, the limited availability of standards.
Also, controls with really high analyte concentrations or heterogeneous controls.
And then finally, the absence of quantitative graphs, like leiogenic spots in clinical chemistry, do not allow a lab to monitor and document day to day variation in staining control.
EQAs play a critical role in proficiency testing and quantization of diagnostic pathology labs, and they’re an important tool in the quality control and quality assessments in the pathology lab.
The issue, however, is that the frequency of quality rounds is only once every six months, once every twelve months, or even lower for for some tests, and that there is no day to day view on how the labs perform.
The graph on this slide shows the scores of participating labs or, in this case, over seven different EQA runs. And for these labs, you see that labs sometimes score high, efficient, stain quality, and sometimes low, insufficient standing quality. But in all cases, even for really good labs, there is no view on what the results would be on a day to day basis.
And we now see that there is significant variation on a day to day or slide by slide basis.
The field is recognizing these issues, and there is also different proposals for improvements.
First, the new latest version of the ISO standards, one five one eight nine, stipulates the use of third party controls and statistical methods to monitor and detect shifts and trends in performance.
And a recent editorial by Clive Taylor and Magnani proposed that the IHC should be regulated as an assay and not as a stain, and this would have significant impacts on how IHCs are quality controlled.
Qualitopix, which is the what I will be talking about today, is a new tool that provides actionable insights.
It moves from how QA QC is done today to providing real time dashboards with actionable insights.
Today, issues can be difficult to pick up even when you’re using positive or negative controls.
Many problems are not picked up by these positive negative controls because intermediate levels closer to the diagnostic cutoffs are not looked at.
And then curated tissue controls can be subject to heterogeneity and quality issues themselves.
Let me talk about what Qualitopix exactly is.
The solution is shown here in a very simple way. The idea is that you take known reference material, I mean, known expression level, and that could be engineered cell lines, peptide coated microbeads, or in the case of H and E, a biopolymer.
That reference material is then stained using your normal protocol, your normal equipments, your normal clone, and then analyzed using Qualitopix. And the output of Qualitopix is quantitative Labigenics plot as shown here.
It shows over time the results, expression levels, and you’re able to track the performance over time.
If a result falls outside of a set bandwidth, then it’s highlighted in yellow, indicated that something needs attention and that someone needs to investigate if there is something wrong.
On the bottom of this slide, you see the the workflow of how this actually works.
A lab obtains standardized reference materials, places those on the slides, could be with patient material or stand alone slides, have the reference materials stained, digitized in some way using a scanner, for example, and then upload those images to Qualitopix.
Qualitopix then relatively quickly within minutes provides quantitative results as shown above, and then the lab technician decides on what the next steps are.
Should corrective action be taken or not?
Qualitopix is an AI powered tool designed to assist laboratories in maintaining consistent staining of high quality.
The Qualitopix front page shows the available services and if the latest tests require your attention.
To investigate the results for an individual service, click view.
The ER service consists of four cores, which is represented by four plots.
Each cell line core is represented by a dot on each of the plots.
You can click a data point to get more details about the staining date, scanner, staining instrument, etcetera.
To get an overview of the individual stainer performance, you can use the Split By feature.
Here we see outliers coming from a certain staining instrument, so we will investigate this further.
Click edit view details to visually inspect the data.
You can use the compare feature to visually compare with a core within range. This can sometimes make it easier to understand why the score is different.
In this case, it turned out to be crystallization on the nozzle tip. In the timeline we can see the inconsistency and that the machine returned to its previous performance level after correcting the issue.
As shown in the video, quantitative monitoring using Levy Jamming’s plot allows you to have data driven acceptance ranges.
These acceptance ranges allow you to identify very quickly when a test is outside the expected model.
Statistical assessment is done based on self set ranges or based on automated settings based on the two standard deviation on historical data.
The upper and the lower thresholds for each core can be set independently allowing tuning of how sensitive the assessment is.
Qualitopix allows for streamlined troubleshooting and documentation.
As already seen in the video, it’s possible to inspect the images of the different tests. It’s possible to break out the results for different staining instruments, and results and metadata can be exported in Excel or PDF format and can be stored for the QMS.
Qualitopix is easy to get started with. It’s designed for a frictionless setup and has an intuitive workflow.
A new test basically can be added to Qualitopix in the drag and drop fashion, and it can be done for any browser with access to the Internet.
No PACS or IMS integration is needed.
No PHI is uploaded, so no data governance concerns.
Results are available on average within fifteen minutes, typically within five minutes.
And it takes three less than three minutes to create a test.
Qualitopix works with all major all site scanner brands. And if you don’t have your own scanner or don’t have access to the scanner, there’s a low cost, low volume scanner from Grainneat available as an option. Qualitopix works with multiple types of reference materials, one of them being cell lines.
Cell lines are genetically engineered to have standardized analytes expression levels in each core.
Typically, a control has a negative to mid range and one high level of expression.
Cell lines do not have the issues that tissue controls may have, like analytes heterogeneity as you are cutting through the tissue block or expression levels that are too high to be detected visually and therefore not being able to pick up errors or changes in staining intensity.
Cell lines are provided by multiple external offenders and Qualitopix has been validated in close collaboration with histocidal laboratories and array science.
An example of the result using cell lines is shown on this slide.
You see here two PDL one cores with the same expression level stained on different days in the same lab on the same staining instrument.
On the left, you see that the expression is really not sufficient, and you see that there is only moderate to weak staining.
And Qualitopix indicated that here attention is needed.
On the right, you see staining as expected, and the result is within rates. And you see when comparing the two that they’re significantly different.
Another example of reference materials that work with Qualitopix are beads.
These beads can be used as controls and as calibrators during asset validation.
The beads are tiny glass microspheres that are coated with known concentrations and light. These concentrations can be traced back to MIST standards.
The calibrators, when used as calibrators, allow a lab to determine the exact LOD, the lower limit of detection, and this is described as critical in the Taylor Magiani editorial.
Visiopharm has collaborated with Boston’s cell standards, PCS, to validate the use of beads with Qualitopix.
Another example of a reference material that can be used with Qualitopix is a biopolymer for measuring stain and consistency of HME.
NPIC have developed a tissue mimicking biopolymer that can be used as an HME control to quantitatively monitor HME staining consistency.
The biopolymer and Qualitopix are currently being validated in two big studies in the UK together with NPIC.
Qualitopix is compatible with different reference materials as already set, different staining instruments, different biomarkers, and clones.
In the table on this page, you see an overview of the biomarkers and stains supported, notably PDL one, MER two, ERPR K sixty seven, and the supported clones and reference materials.
On the road map, come very soon, are different MMR markers, h and e, and more than ten markers that are in the pipeline that will be released soon. And supports for new clones can be expanded on a case by case basis.
Qualitopix will soon enable high volume usage and live quality control in the lab environment.
We are in the process of supporting on-site usage on every sample. So for every patient sample, a test can be done, and that requires a fully automated upload of the reference material without the patient material, without the PHI.
We’re also creating a dashboards to be used in the lab, reducing the IsoTech workload for doing manual reviews and improving quality for each slide.
Let me now show you some proof points that have been generated by actual use of Qualitopix in labs.
First of all, we co develop Qualitopix with our customers, and we continuously use the feedback of our users to continue to improve the platform. On this slide, you see quotes from four of our users, and we show how they use Qualitopix and how they successfully identified root causes and mitigated errors using Qualitopix.
And these these quotes come from Utrecht in the Netherlands, Auss in Denmark, and Henry Ford in the US.
Qualitopix has helped identify different sources of errors for our users.
We broadly see three categories.
First, we seek a global category, where there’s something wrong with a type of instrument, an essay, or there are protocol issues.
Secondly, there could be specific instrument issues, specific position instrument issues.
And then finally, there may be interstainal differences.
So global, within a a system, and then between systems.
What we have seen is that our users start to link outliers as detected with Qualicopics to root causes.
And the list of root causes that have been successfully found and linked to outliers is getting longer almost every day.
On this page are a few examples, and I will show a series of examples with real life data in the next few slides.
The first example is a bat reagent lot, which was discovered using coral copies.
The lab performed multiple HER2 runs over time.
At some points, they saw a significant spike in the scores of certain saline cores for HER2.
When they started to investigate, they realized that these outlying results were linked to a change in the reagent lot.
And when switching back to the original lot, the numbers as detected in Qualitopix returned to the normal values.
The second example is the detection of an insensitive for a tube clone using Qualitopix.
The lab set out to compare the performance of two staining instruments of the same wall.
They saw some variability between the instruments, but more importantly, they realized that there was almost no signal on the one plus and two plus cores and that also the three plus core was weaker than expected.
Note that these intermediate, expression levels are the ones with most impact on patient’s diagnosis.
When they troubleshooted further, they decided to test another clone, clone b in this example. And then they found that both instruments were very comparable and that they were able to generate the expected signal and therefore detected an issue in their HER2 testing and really also solved it and made a major improvement to their staining quality.
This plot shows an example of how Qualitopix helped the lab to detect that there was something wrong and that crystallization had built up at the dispenser nozzle.
So multiple HER2 and ER runs over time on the same stainer, showed outliers at different points in time. And when investigated, they found that there was crystallization at the dispenser nozzle and removal of these crystals caused the staining to return to the normal values.
In the next few slides, there are a few examples of positional inconsistencies detected with Qualitopix.
In this case, the slides in the slide rack were not positioned evenly. So the slide rack was slightly tilted.
And on the right side, you see that the the results on the positions twenty one till twenty nine were really lower as expected.
And when the issue with the slide record was corrected, subsequent tests showed that there was much more even staining across the positions.
Another example of positional inconsistency was due to heating pad issues. Another lab tested HER2 for all the positions. They saw that there were outliers on the lower side and the higher side. And when looking into it, they found that some of the heating pads were damaged. And by fixing them, replacing them, they also removed this inconsistency, the the uneven staining for the different positions in the machine. As a third example of positional inconsistencies detected with Qualitopix, I show here the before cleaning and after cleaning results.
In this case, data is shown over two plus, her two core for different positions in a machine.
Before cleaning, the results shown in light pink have much more variation than after cleaning darker pink.
So Qualitopix can also be used as a tool to potentially flag when a machine needs to be cleaned, and after cleaning, documenting the results and showing consistency afterwards.
Qualitopix was also used by large US reference labs to document and check the consistency across shifts.
This lab runs three shifts a day, seven days a week.
They used Qualitopix to monitor the consistency between shifts and for different markers, and they were able to show that each shift was significantly similar to other shifts. So they were able to show that they had really consistent staining across markers, across shifts in their lab. The same lab used Qualitopix to demonstrate objectively the maturity of their QA QC process.
US reference lab invests and goes above and beyond end the recommendations.
It wants to benchmark their performance for PDL one and IRR two against seven other labs using Qualitopix. In the graph, you see the eight labs from bottom to top, which the the reference lab on top indicated by the error. The variation, the variability for each lab is indicated with color, red being very inconsistent, larger variation.
While at the top, you see the the performance being superior for the the lab that tested using Qualitopix.
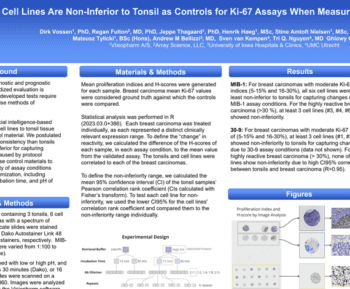
We also are doing different scientific studies on Qualitopix, and this slide shows an example of a forced field study for KS sixty seven. It was a collaboration between U of C Utrecht, IOWA, and Array Science. And cell lines were compared with Tonsil in how sensitive they were to detect changes in breast cancer sample. And it was shown here that cell lines and Qualitopix was much more consistent with the breast cancer samples than tonsil as a control. Cell lines and Qualitopix together could detect changes in pH, incubation time, and antibody dilution for different forced fails in the protocol.
Qualitopix has also been studied in a forced failed study for HER2 in breast cancer.
This study was done together with Nordic QC. Qualitopix and cell lines were shown to be able to detect changes in protocols, such as pH of the retrieval buffer, antibody dilution, incubation time, and the detection kit.
Also, different sections thicknesses were detected.
Human only categorical assessment of cell lines was significantly less sensitive than when using AI in Qualitopix.
More importantly, it was shown that the sensitivity for changes with clinical impact went from eighty five percent to ninety six percent when the human pathologist was assisted with Qualitopix.
And further studies, together with NordicQC, are being planned. These forced field studies are being published right now.
We also have other publications using Qualitopix, and a few are shown on this slide.
The collaborators are shown together with the assays that have been studied. Go to our website if you wanna see more detail or if you wanna download some of these publications.
I wanna call out doctor Omar Baba from Henry Ford’s help, who will give one of the following master classes describing real life examples that he studied.
That brings me to the final part of the presentation, and that’s what can Qualitopix do for your lab. As shown, Qualitopix has multiple benefits for pathology lab.
First, it allows you to trust your staining because you know in a quantitative way over time how your lab is performing. Quanttopix is simple to get started and simple to use because you don’t need complex IT systems. There’s no PHI involved, and the workflow is very simple.
And it allows you to be prepared for new demands in QC and new regulations because you now have objective, quantitative records that you can show if needed. Learn more about Qualitopix by visiting visualfound dot com slash Qualitopix, and you can also sign up there for a demo on Qualitopix.
Thank you, Dirk, for the webinar.
So we’re open for questions now. So if people have questions for Dirk, it would be great to just place them in the chat, and you can sort them out.
So first question from Leticia. How do I choose between beads and cell lines?
That’s a that’s a great question.
I think that’s that really depends on the, on the application that you’re looking at. So there are some differences in how these reference materials, are used and how they can be used, and there are also some differences in what kind of essays that they support.
So we can, go into more detail what’s best and and most suited for your for your situation.
Mhmm. And question for Matt. How often should labs run these tests? Does it change between different markers?
I think that’s that is more, so I would say, first of all, it’s most relevant, most important to to run these tests for the, predictive and maybe prognostic markets where there is really a quantitative aspect to the interpretation of the of the essay.
And then it really depends on the on the use case that’s that you may have in your lab. So we see that some of the customers that we work with, use this every day, for example, to establish establish a baseline.
But we also see that people are starting to use it on every, patient sample so that they know what the status is for for every sample.
Mhmm. Okay.
Next question from Johanna. What are the advantages of the life assessment for each slide?
So that the turnaround is quite short, I think.
Sorry, Bettina?
I think that refers to the short turnaround time that, Yeah.
Call it offers.
Yeah. So I think, if if you have a very quick feedback, like live, feedback, then then the time between something figuring out that something is wrong and the troubleshooting should start is is as short as it can be. And that’s that allows quicker fixing things, but also maybe hold back, slides, going to the pathologist until issues are fixed or or at least understood if there is an issue.
Mhmm. Okay. Question from Jamie. Will this be developed for special histochemical stains?
That’s a that’s a very nice question. We are we are looking at our road map, and we are investigating different, areas to kind of, bring this forward in. We have started with, IHC. Obviously, we’re now taking the step for for h and e.
If you have something special in mind for the special, stains, then then please let me know. Contact me. I I would be happy to to discuss with you what, what you’re thinking of.
Mhmm. Question from Sven. Are there any stainless that stay more stable compared to others in your expertise?
Any stainless that stay more consistent?
Yeah.
Well, maybe yeah. We we we do see the the the difference between staining platforms. We also see, difference between between protocols used, the RTU kits. So so there’s definitely a difference that that we see. Yep. Absolutely.
Mhmm.
And question from, Richard. When working with paraffin blocks, sectioning thickness can have a big influence on standing intensity. Can the tool fit our sectioning thickness and compensate for that?
Yeah. That that’s I I think that’s that’s something that’s that’s in the current workflow is is quite difficult to to take into account and and correct for and with with Qualitopix. And I think I showed that on on the last slides on the, forced fail study with Nordic UC.
We are looking at what the section thickness has of impact, and we we do see that it’s possible to to detect that, because you have the known reference level. And then if you see that go up and down, you you are able to say something about the, section thickness. Yeah. How that propagates to to the, diagnosis and maybe potentially propagates to AI for decision support, that’s something we’re looking at.
Okay.
Next question from Jose. What is the major contribution in CDX assays accuracy such as PDL one and HER two?
The major contribution in variability, I assume.
I think we we we are learning what’s what the different, sources of variation and and their relative contribution are. I I showed a long list of things that we have seen, and and we are stud studying it more systematically, but but we definitely see that there are a lot of of things that, do potentially have impact.
So I think we’re we’re we’re still learning to to, to really pinpoint that.
Okay.
And a question from Matt. If a lab has the ability to develop their own cell lines, can they be used as part of Qualitopix to generate more tests, or does it need external testing via some EQA?
Yeah. I I think that that’s a good question. The for for Qualitopix and the cell lines too or other materials like the beads, for example, but for them to work together, it is important that the whole system is being validated. That that, of course, is work, and it’s important to do that rigorously. So if if a lab have have their own cell lines or their own solutions, that’s that would require some work. So if if that’s the case, then it needs to be discussed, and we need to kind of find out what’s what is exactly, needed and and needs to be done.
Okay. And I think another question from Jose. Do you have any IHC pre analytics guidelines as a reference material?
Yeah. So so these these reference materials, they they have already been, fixed and and and, went through the pre analytical phase, so to say. So before the staining.
So that that’s if there are changes that may vary from batch to batch, and that is all validated and and taken care of.
I think for the for for the staining itself, it’s it’s taken into account, and and the recommendation, of course, is to to follow the instructions for use that come with with the, with the kits and the instrument that that you’re using.
Mhmm.
Okay. So, then, to close this, thank you very much, Dirk, for showing Qualitopix. Thanks everybody for joining.
Bye bye.
Bye bye.
Dirk Vossen will introduce Visiopharm’s Qualitopix solution, which allows the monitoring and documentation of staining consistency. Learn about how easy Qualitopix fits into your workflow without the need for installation or integration. Be ready for new demands and regulations as the community is seeing the need for more regulation on IHC staining especially for predictive purposes. Dirk will also show the results of the first Qualitopix customers, who were able to identify unexpected shifts in their staining intensities. The labs already identified different reasons for the inconsistent staining, which will be explained.

Dirk Vossen, CDO, Visiopharm
Dirk Vossen leads a cross-functional team to develop diagnostic and clinical applications of digital pathology. His track record of creating value through innovation in digital and computational pathology spans the entire range of development, from ideation through validation and certification of medical devices, as well as commercialization strategies.