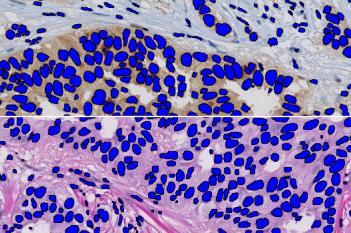
The outputs of the device are:
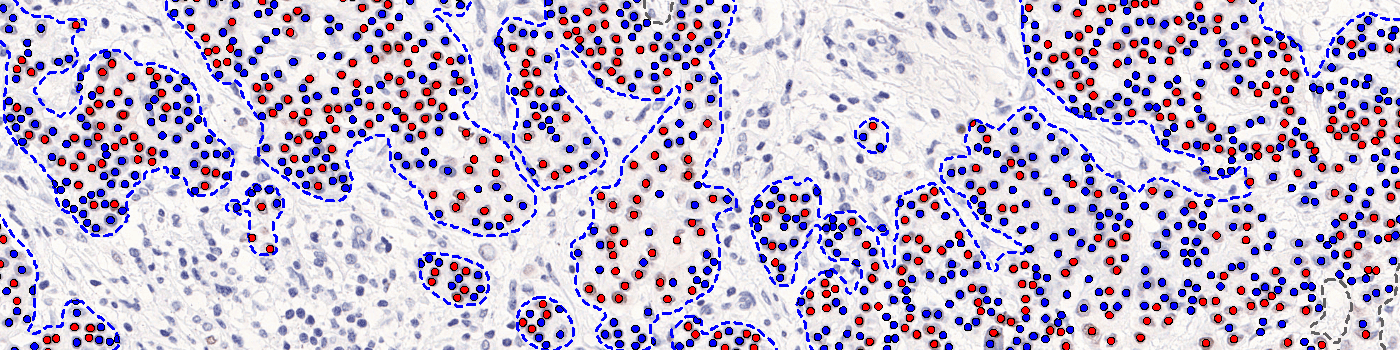
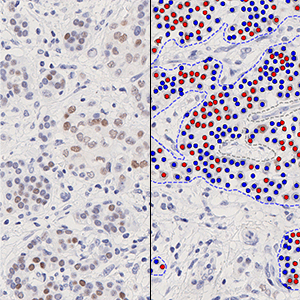
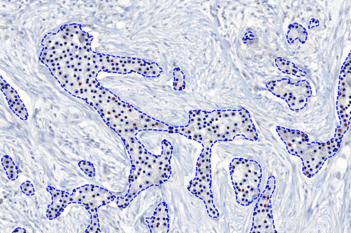
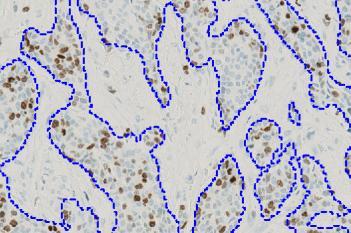
Total Nuclei [#],
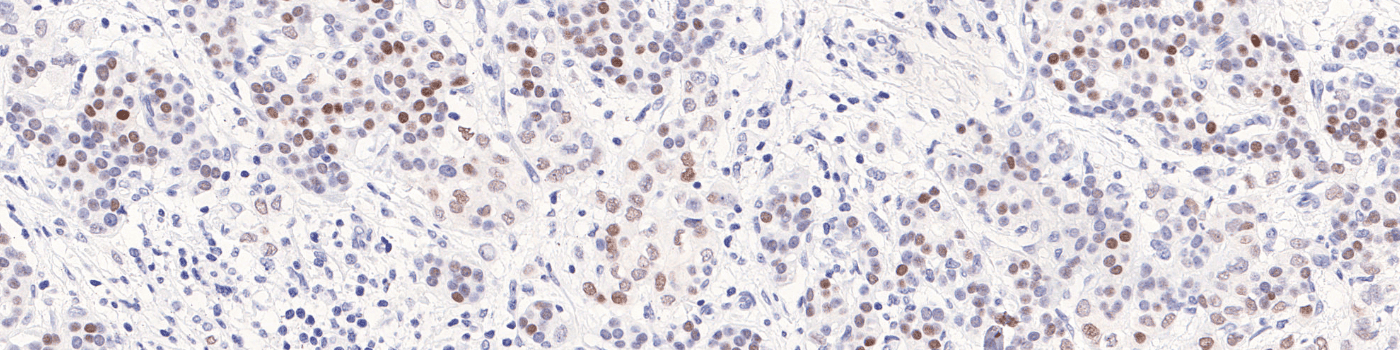
which is the total count of detected nuclei in all invasive tissue
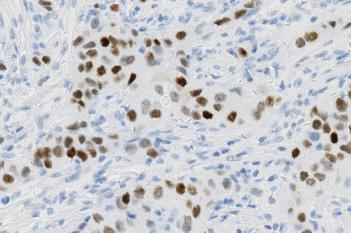
Positive Nuclei [%],
which is a value between 0 and 100 and is calculated as
Positive Nuclei [%] = (Number of PR positive nuclei)/(Total number of nuclei) × 100
An optional output is the
Allred Score,
which is a value between 0 and 8 and is calculated as
Allred Score = Proportion Score + Intensity Score
where Proportion Score is a value between 0 and 5 which reflects the positive percentage, and Intensity Score is a value between 0 and 3 which reflects the intensity of the PR positive nuclei.
The secondary outputs of the device are:
Neg Nuclei (#), which is the number of tumor nuclei negative for PR
Pos Nuclei (#), which is the number of tumor nuclei positive for PR
Allred Proportion Score
Allred Intensity Score