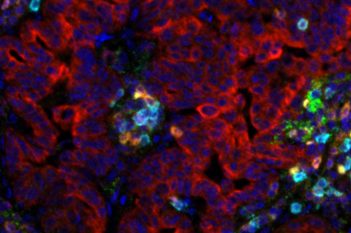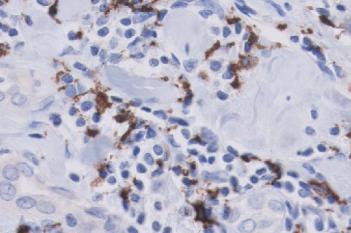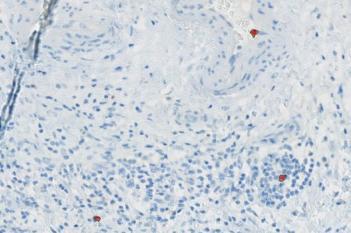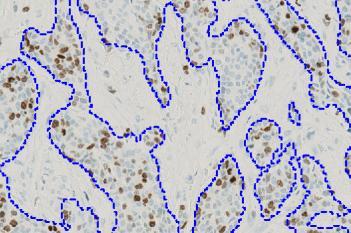
Ovarian cancer tissue stained by IHC for CD8.
#10107
The CD8 protein is found on a subset of cytotoxic T cells. CD8+ T cells can recognize cancer antigens and inhibit the development of cancer. A high frequency of intraepithelial CD8+ T cells is a positive prognostic factor in most solid tumors including ovarian cancer, see [1].
This protocol can be used to assess tumors by determining the CD8 positivity. Tissue and tumor regions are identified and outlined automatically prior to the CD8 analysis by auxiliary APPs. The protocol provides the number of positive and negative nuclei as well as the positive percentage. By allowing the user to adjust the sensitivity for the detection of nuclei and vary the threshold for differentiation between positive and negative nuclei, the protocol can be used on images with different staining intensities.
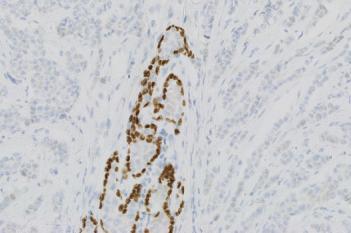
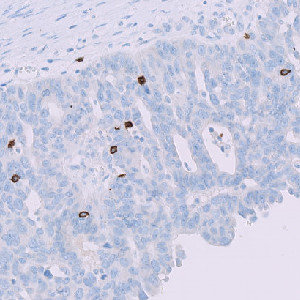
Ovarian cancer tissue stained by IHC for CD8.
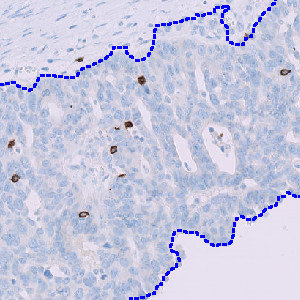
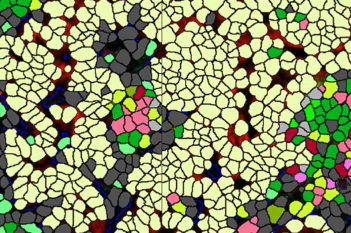
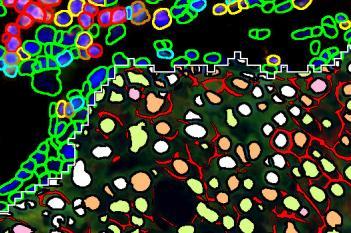
Tissue from FIGURE 1 analyzed by auxiliary APP ‘02 Detect Tumor’. The tumor region is outlined by a blue dashed line.
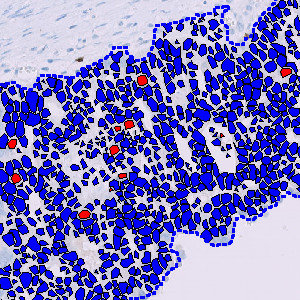
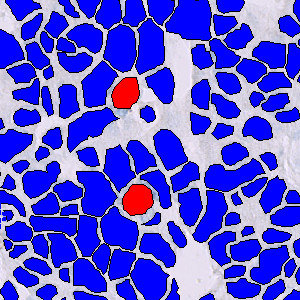
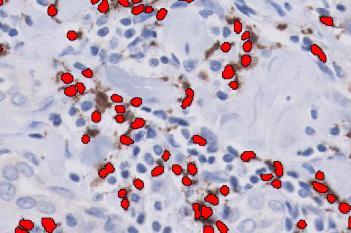
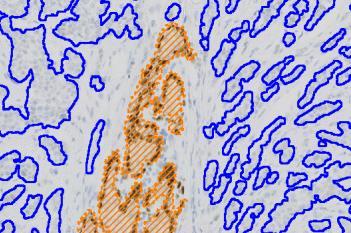
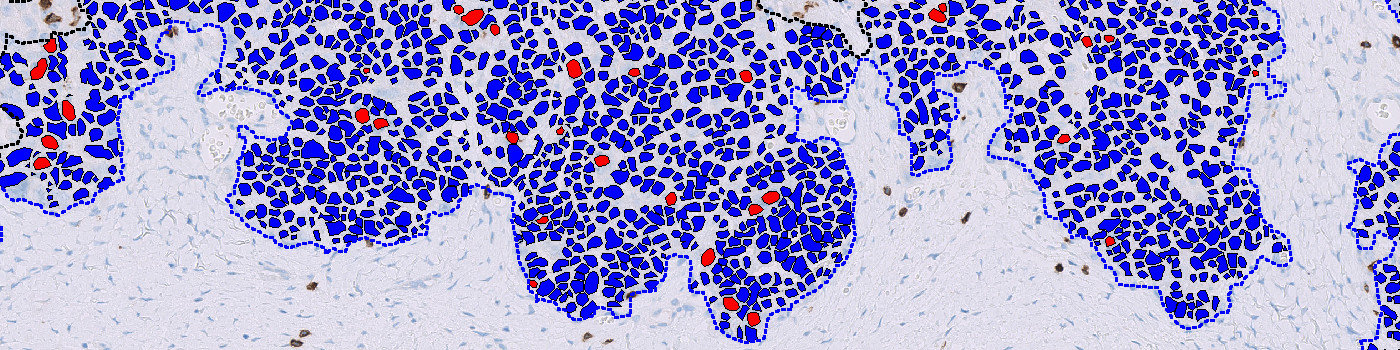
Tissue in tumor region from Figure 2 analyzed for CD8 positivity. Positive and negative nuclei are marked with a red and blue label, respectively. From this classification, the output variables can be calculated.
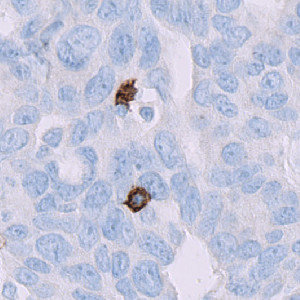
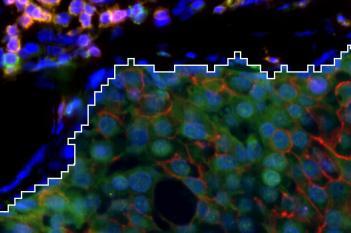
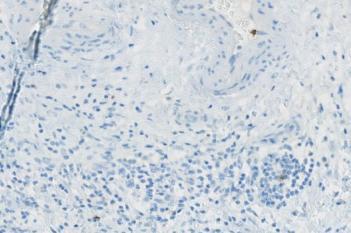
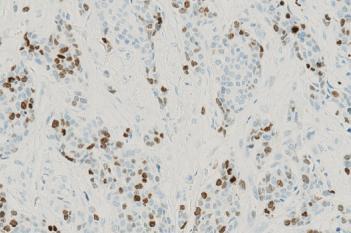
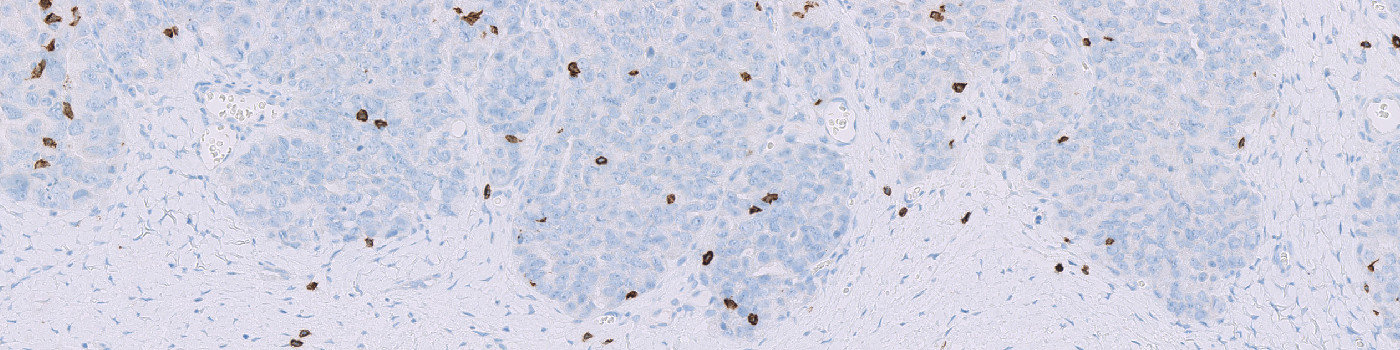
Close up of nuclei in tumor region.
Auxiliary APPs
APP: ‘01 Detect Tissue’
APP: ‘02 Detect Tumor’
Quantitative Output variables
The output variables obtained from this protocol include:
Workflow
Step 1: Load and run auxiliary APP ’01 Tissue Detect’ to detect and outline tissue in image.
Step 2: Load and run auxiliary APP ’02 Detect Tumor’ to detect and outline tumor regions in the tissue. Manually correct the identified tumor regions if neccessary.
Step 3: Load and run the quantification protocol “03 Detect CD8 Nuclei” to analyze the tumor regions for CD8 positivity. Click the save button to transfer the results to the database.
Methods
The nuclei classification begins with an image processing step that involves a segmentation of all nuclei in the ROI. The segmentation is based on a threshold classifier, which makes the classification easily adjustable to stain intensity. Cells clustered together are separated based on shape and size. The positive cells are distinguished from the negative based on the HDAB-DAB color deconvolution band. The resulting classification is seen in FIGURE 3 and 5.
Staining Protocol
The staining protocol has not been specified.
Keywords
CD8, positive percentage, immunohistochemistry, quantitative, digital pathology, image analysis, ovarian cancer, ovary, cytotoxic, Tumor Micro Environment.
References
USERS
The APP was developed in collaboration with Marianne Waldstrøm, Christina Braad Petersen and Jon Røikjær Henriksen, Department of Clinical Pathology, Vejle Hospital
LITERATURE
1. Santoiemma, P. P., Powell, D. J.. Tumor infiltrating lymphocytes in ovarian cancer, Cancer Biology and Therapy 2015, 16 (6), 807-820, DOI.