Transcript
Hello, everybody. We’re just waiting a few minutes for everybody to register and join the room, and then we are gonna get started very soon.
Alright.
I think we can start. So welcome, everyone, and thank you for joining today’s webinar with Visiopharm and Molecular Instruments.
My name is Leticia, and I will be your host for today’s session.
So we have an exciting session ahead, actually, featuring three experts who will be sharing insights on enhancing RNA ish spot detection with dual channel stating and AI analysis.
So I wanna welcome our speakers, which are, Randy Chen, director of r and d at Molecular Instruments. Then we have Dan Winkowski, senior technical sales specialist at Visiopharm. And finally, Reagan Bernd, SVP research commercial strategy department at Visiopharm.
And just before we start, quick reminders.
There will be a live q and a at the end of the session. So if you have questions, you can submit, on the chat.
And this this session is being recorded, so you you have a chance to rewatch, you’ll share with everybody at the end.
So I guess we can just get started now.
Enjoy.
Hi. This is Randy Chen, and I’m the director of r and d at Molecular Instruments.
Hi. This is Randy Chen, and I’m the director of r and d at Molecular Instruments.
This will be a joint presentation between MI and Visiopharm on the topic of enhancing RNA ish spot detection with dual channel staining and AI analysis.
I will be representing MI talking about HCR RNA ish assay, and Dan and Regan will be representing Visiopharm discussing how RNA ish data can be analyzed using Visiopharm software.
In this presentation, I would like to explain how HCR enabled RNA ish works and some of the challenges that users face in qualification of RNA ish probes.
And, finally, I’m going to introduce the concept of DCV, which is the acronym for dual channel validation.
And I’m going to show how these challenges can be addressed by DCV.
HCR stands for hybridization chain reaction.
It is an amplification mechanism that’s at the core of every molecular instrument’s products.
And the secret sauce of the amplification is that these m HCI amplifiers are sequestered in hairpin conformation, and each of them is conjugated to a four zero four or an hapten, and they do not interact with each other in solution unless initiators are present.
And initiators are short DNA sequences that are right next to the probe binding sequence.
And after probe hybridization, the initiator I one opens h one amplifier.
The initiator sequence in the opened h one amplifier will open h two amplifier.
H two amplifier contains the same sequence as I one, which causes the next h one amplifier to open, and the process repeats itself that leads to the formation of fluorophore or hapten label HCR polymer.
One of the major features of HCR assay is that the largest component of the assay is the HCR hairpins, which are only about one point five kilo Dalton.
And this is significantly smaller than RNAH impropriers of the other RNA ish method.
And this feature eliminates the need for harsh protein suggestion, which can negatively impact code detection of protein targets.
And because HCR assay is protease free, it allows negative compatibility with IHC targets.
And image here shows the code detection of polar two a as RNA and membrane marker as protein in FFPE human lung cancer.
And sometimes, as a membrane marker, BAP can overpower the ish signals during data analysis.
So user can choose a more translucent chromogen such as green or yellow.
This example shows a very nice cell segmentation using yellow chromogen as the membrane marker.
Again, the protease free asset allows membrane and nuclei features to remain intact.
Then from VISOFORM later on will show us using their software, how we can better do cell segmentation and allow more accurate dog counting using HCR and HSA combined with membrane marker.
And before diving into dual channel validation, it’s important to understand some of the challenges that we face to qualify RNAH probes using conventional methods.
So one conventional method is bulk RNA sequencing for whole tissue transcriptomics.
This method can tell you the transcript abundance, but the downside is you don’t know where the targets are expressed. In other words, you lose spatial information for the target of interest.
And RNA detection in controlled tissues is another way to show if your probe is binding to a target of interest.
However, it’s not always easy or even possible to find positive and negative control tissues for every RNA target that you are trying to detect.
Another common way to qualify RNA age probe is qualification with IHC marker.
In this example of ERBB two detection, we see a positive correlation between protein and RNA abundance.
However, if you look at the images on the left, how would you interpret the result in this example where you have RNA ish staining but with IHC score of zero? And moreover, from literature, we know that protein and RNA expressions don’t always correlate, and it’s not always possible to find the RNA counterpart of primary antibodies commercially.
And so what do we do when validated antibodies are not available?
And what do we do when we question the validity of the ish signals?
And we believe that dual channel validation is the answer to these questions.
The way DCV works is, first, you start with two independent sets of probes, but they both target the same RNA of interest.
Then you run through the DCV assay resulting in signals into separate channels, And the degree of colocalization and correlation of signal intensities will allow us to validate probe specificity as well as make inferences about the transcript abundance.
This validation method is standardized, meaning you follow the same procedure for every probe you want to validate, and it’s self contained because you are using the probe itself to conduct the validation.
Just to illustrate the methodology of DCV with an actual example, here, you we have a GOP on our probe set. First, you split the the probe set into two groups and detect the same target redundantly in different fluorescent channels.
Then you run these raw images through a script, and that will give you the colonization factor and correlation coefficient.
And based on this number, it results in a DCU score of three plus.
And the reason DCV can be used to verify probe specifically is that if signals from two different channels are detected at the same location, we are very confident that the colocalized signals are real and specific because it’s extremely unlikely for two false positive signals to colocalize at the same location.
And a good analogy would be if you consult two different doctors and both give you the same diagnosis, then you will be very confident that the diagnosis is correct because it’s unlikely that they both give you the the same false diagnosis.
DCV scoring guide is developed internally along with experts who are routinely doing on a ish and also with pathologists who are making diagnostic decisions based on the expressed signals.
The score ranges from zero to three plus. Score of zero doesn’t mean the probe is not working. It just means it hasn’t gone through the DCV process.
And having a score of one tells us the probe set is sensitive and specific.
And having a a score of two, three, and three plus enables us to make inferences about target abundance based on the observed signal intensity.
And it’s important to know that having higher score doesn’t imply higher sensitivity or specificity.
Having higher score just means you can make more precise inference about target abundance based on observed signal intensity.
So this is a pair of raw fluorescent images of mouse polar two a in two separate channels.
After running the raw images through a DCV script, it resulted with a score of three.
And polar two way is, is commonly seen as a low abundance housekeeping gene, and then later on, we’ll demonstrate dot counting with this particular target.
We have also validated a number of clinically relevant targets. This one shows the validation of high risk HPV probes, and we know HPV is associated with development of various forms of cancer.
So it’s critical that we validate the probe specificity before giving to users who are making diagnostic decisions.
And we had a user who ordered a probe that targeted LRRC fifteen, which is found to be highly expressing tumor stroma.
And we were asked to validate this probe on the tissue samples that he provided.
And we were able to validate the probe set on all of the tissue sample types that he provided.
And I’m only showing one here with human breast cancer tissue, and that resulted in a score of three.
And this illustrate that DCV can be applied to any probe set and on any FFPE tissue sample types.
And thank you all for your time. Now I’ll hand it over to Dan to dive into the analysis of HCR Pro images using Visiopharm software.
Thanks for the presentation, Randy, and thank you for the introduction. Hi, everyone. It’s a pleasure to be here today to talk about a major challenge in the fast paced world of spatial biology, accurate cell segmentation as it relates to spatial transcriptomics, and specifically how AI driven methods, particularly membrane aware approaches, are changing the game.
As many of you know, multi omic tissue imaging is rapidly advancing, allowing us to analyze gene expression in spatial contexts.
One of the persistent challenges in multi omic tissue analysis is dot detection, process of assigning RNA ish signals to individual cells. If we can’t define precise cell boundaries, we risk drawing inaccurate biological conclusions.
So today, I wanna walk you through why this is a problem, limitations of current methods, and how AI driven segmentation using membrane stains offers a powerful solution.
So let’s dive in.
To understand why segmentation is so important, let’s take a step back. When we analyze gene expression in tissue samples, we’re dealing with RNA signals scattered throughout the tissue. But to make sense of this data, we need to assign each RNA dot to its correct cell. So what’s the problem?
Cell boundaries aren’t always clear, especially if we rely on nuclear staining.
As a result, traditional segmentation methods can fail due to misassigned signals or reduced sensitivity.
This lack of precision presents a major obstacle in transcriptomics, making it difficult to extract meaningful, reproducible insights.
So, for example, in the image on the top, right? You can imagine the challenge of linking dots to specific cells, especially when you cannot confidently define the cell boundary.
So, what’s the solution? As we just heard from Randy from molecular instruments, they’ve developed dual stain method that identifies not only the cell nucleus and RNA targets, but also stains for the membranes so that we the cells can actually be identified.
This helps guide how the cells should be divided and where the cell boundaries are located.
This is where Visiopharm’s discovery platform can come in. We offer an AI driven platform, which we can train an AI to segment cells based on nuclear and membrane stains and correctly identify cell boundaries in your spatial transcriptomic workflow.
This ultimately can lead to reliable, reproducible, interpretable results.
Now, we worked with molecular instruments team on a project in which we applied the currently available analysis methods for RNA dot detection to their images and compared the results. And here’s an overview of what those methods that we use were. First, manual annotation.
Here are human observers manually identify cell boundaries based on visual interpretation.
While this can sometimes be accurate, it’s extremely time consuming, highly subjective and suffers from a high amount of variability.
Same image analyzed by two different experts may result in different segmentations.
Even the same image analyzed twice by the same observer isn’t going to be exactly the same.
This lack of consistency is a major limitation, especially in large scale studies.
The second method that we tried or we applied was this, was our pretrained AI nuclear detection algorithm.
Now this is a much more automated approach where our pretrained AI is used to identify nuclear staining and cell boundaries are estimated.
In this case, the AI model finds the nucleus, expands outward, specified distance, and produces a rough approximation of the cell shape. This method is faster and more consistent than manual annotation, but also is not without its drawbacks, and I’ll touch on those later.
Finally, we developed a membrane aware AI in our discovery platform.
And this method takes advantage of both nuclear stain and the membrane stain in the tissue, allowing the AI to learn, the true cell boundaries for the cells in the sample Incorporating both nuclear and membrane signals, we get a much cleaner definition of cell edges.
So that’s a brief overview of the project and let’s take a look at these approaches in a little each of which in a little more detail.
So, first, up is the manual approach.
We asked a set of colleagues to manually identify cells in the same field of view and the way they did this was just to place a number over the cells in the image. They each provided the same field of view and then identified each, the cells by their reporting, by placing a number over the cell. So exactly what the numbers mean, or where they are isn’t necessarily critical.
But what is critical is a simple number of, the count that each observer found the count of cells that each observer identified. And as you can see, if we tally those numbers up for each observer, there’s a wide range. Right? There’s, anywhere from about thirty cells to fifty cells and that’s a big difference, with such a large range in the data. There’s also some considerations for the downstream results. Remember, we’re ultimately trying to count the dots in each cell and we have a big difference already with just the cell counts.
But some of the other considerations are how long did it take to get to the results? How accurate are the results? And what is the whether it was the ground truth that each person used, presumably, that’s slightly different for each observer.
Are the results variable? Well, the cell counts indicate that, but, also, what if we ask the observers to do it again on the same image? Would we get the same answer?
Finally, all these factors speak to whether the results are reproducible.
So there are some obvious drawbacks to this method and probably many more.
But let’s just say that this is probably not the best course of, to pursue for analyzing these types of data.
Okay, next up is our Pre trained model for nuclear detection. So, our, this is by far a much more automated approach where our AI is trained to detect him as oxygen staining and estimate where the cell boundaries are located and.
Here’s what that, output looks like. So.
The estimation of the cell boundary is simply achieved by expanding from the nucleus outward and producing a rough approximation of the cell shape.
As I mentioned, this method is faster and more consistent than the manual annotation, but it too has some significant drawbacks.
It makes a lot of assumptions. It assumes uniform cell sizes, uniform cell shapes, moreover cells without a visible nucleus might be important upon evaluation.
If we look at the outlines of these cells, we’re doing a really good job finding the nuclei. But if we examine the outlines, created with this method, quite often, they fail to match the actual boundaries of the cells. Sometimes the boundaries here drawn here crossover an actual membrane as shown by the staining. So that’s obviously a concern. Moreover, we’re missing many objects that strongly resemble cells, but don’t have an apparent nucleus in the plane of section. Ultimately, this can lead to uncertainty about which dot belongs to which cell and can greatly influence the results and interpretations of the study.
Last up is our membrane aware AI that we developed in our discovery platform. Now this method takes advantage of nuclear and membrane stains and allows the AI to learn the true cell boundaries based on ground truth coming from the chemical stain. So, let’s take a look at some of the results using this method.
So, here are the cells identified using this method. You’ll notice right away that each labeled object mostly follows the full morphology of the underlying cell objects in the image, which will therefore build our confidence in, our ability to assign dots to specific cells, rather than wondering which dot goes with which cell. No, notably here, I’m showing only the cells that are identified to have a nucleus. There are many objects on the image that are not labeled that seem to have been missed, but they still strongly resemble the shape of a cell, especially because they have they’re bounded by membrane state.
So, as I mentioned earlier with this method, we actually can identify those objects as and label them as putative cells. And the user is able to decide whether they want to keep them as cells or not. It is up to the individual as to whether they want to include the cells lacking a nucleus or whether they want to discard them or maybe just analyze them separately. But the important point here is they can be captured by this analysis approach and are available, at this point in time in the workflow and can be part of the measurements.
And so, by incorporating both nuclear and membrane signals, we get a much clearer definition of what the cell edges are, as you can see here with the way the labels are just created to be outlines.
And obviously this approach offers several key benefits. We get. More accurate dot assignment, so are any signals are correctly attributed to individual cells.
There’s greater reproducibility with you know, any automated solutions. We’re gonna get the reproducibility that we’re looking for, you know, and remove the variability that might exist with other methods like the human annotation method.
What I will also add here is that with the staining pattern, these staining conditions, this algorithm can work across different tissue types, making it highly adaptable.
And to that last point, you might be wondering whether the solution is custom to the specific project, or whether it can generalize, across tissues. And the answer to that is yes, it can generalize primarily because the algorithm depends only on the hemotoxins and I see membrane stain here. I’m showing the performance on a few different tissue types that we tested and obviously we’ll continue to optimize in the future in collaboration with the molecular instruments team to create a robust solution for this.
Okay, so here, I’d like to start wrapping up my talk with a visual comparison and the methods we discussed today. And if we just go from the image on the left to the image on the right, we’re certainly advancing from a manual approach to an automated approach for dot detection.
In addition, we’re moving from, you know, an imprecise solution to a precise outlines of cell objects in the tissue and finally from left to right. We’re moving from variable to highly reproducible. Right? So, all those things are benefits as we move from left to right in this, in the sequence of of methodologies.
And now that we’ve compared these approaches, let’s talk about the implications and why this advancement is so important for spatial by spatial biology research.
So first, this method will lead to better biological interpretability.
So, when dots are assigned accurately downstream analyses, such as identifying cells, cell types and gene expression mapping are much more reliable and make a lot more sense. It’s scalable. So large scale studies require automation and reproducible segmentation methods. Our membrane aware AI allows researchers to apply this in batch mode where they can process large amounts of data rather efficiently.
And finally, the robustness across tissues is an advantage because unlike nuclear expansion methods, which may work in some samples, but fail and others is is membrane aware AI is versatile and can work across diverse tissue types and conditions, at least at this time. So we’re looking forward to expanding that capability too.
Okay, so in summary, precise cell segmentation is critical for spatial transcriptomics workflows and, frankly, traditional methods where whether it be manual annotation or nuclear based AI methods, you know, just have significant limitations in this arena.
What was shown here and what I have hoped to have convinced you of is that, by incorporating membrane standing like that. From molecular instruments into, AI driven segmentation methods provided that can be developed in the Visio form discovery platform.
We can achieve more accurate cell boundary detection, improved r and a dot assignments and, increase re reproducibility and scalability.
And together, all these things represent an important step forward in making spatial biology results more reliable and interpretable.
So I’d like to end there and thank you for your time, and I look forward to being able to answer your questions.
Thank you, Dan and Randy, for those wonderful talks.
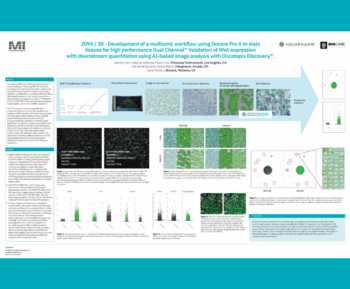
Before I begin, I just wanted to state that the data that Dan presented is available from a poster that we co presented at SITC last year. You can find the poster either on the Molecular Instruments website or on the Visiopharm website, or just reach out to us and we’ll make sure that you get this information.
My talk builds upon what we’ve just heard about ISH techniques and AI assisted cell segmentation. We saw how membrane stains improve segmentation accuracy and help assign transcriptomic signals to the correct cellular compartments.
We’d like to point out that there’s wonderful dot detection that’s also going on in this analysis that was just looked over, But there will be a companion piece to this at AACR in a couple of weeks in twenty twenty five. So look for that.
But now let’s take a step further and look at the future of multi omic imaging as we move from smallplex to highplex analysis and how AI will be essential in this transition.
The move from smallplex to hyplex has some considerations some considerations when it comes to stain consistency and scan quality.
Also, the order of acquisition of the different probes becomes important.
And of course, protease free protocols must be observed if you’re going to be analyzing ish probes and protein at the same time. Consider whether you want to do all of these experiments on the same piece of tissue or in orthogonal experiments through serial sections.
Also, as you’re considering moving from low to high plex, really consider what signals you’re going to be measuring. If you’re looking at protein, you’re likely studying intensity.
Those measurements will be sensitive to the saturation points of the detection systems that you’re using. If you’re doing ish, please make sure that you the fine focus on those instruments are able to detect dots.
And also make sure that you’re including the appropriate markers to delineate the different structures that you’re interested in, whether those are mapping the tissue, cell segmentation, or even subcellular compartments.
Spatial transcriptomics has given us incredible insight into gene expression at the tissue level. However, integrating multiple molecular layers such as protein, metabolites, and even lipidomics within the same tissue sections require new approaches. The challenge is not just data collection but making sense of this high dimensional information in a way that is biologically and clinically meaningful.
One of the key solutions to multi omic integration is a spatial coregistration technique. By aligning multiple imaging datasets from different modalities into a single tissue image, you can share information amongst those different techniques.
Tissue align by Visiopharm enables this by mapping spatial spatial transcriptomics data with protein imaging and other modalities.
This approach provides a richer multimodal view of the tissue microenvironment, helping us link gene expression with cellular phenotypes more accurately.
This was done recently in a manuscript delivered by MD Anderson from Sammy Ferry Boragono and Jared Birx, where they were able to get information for three different omics, proteomics using Linipore Comet, metabolomics using Bruker MALDI, and transcriptomics using STOMICS device from Coupleg Genomics, where they were able to analyze the molecular, metabolic, and subcellular map of the tumor immune microenvironment.
Hyplex imaging is not just about increasing the number of markers. It’s about handling the exponential rise in data complexity. We now have datasets that contain millions of spatially resolved measurements which makes manual analysis impossible.
This is where AI comes in, not just for segmentation but for integrating and interpreting multi omic data at scale.
AI assists at multiple levels from preprocessing and segmentation to advanced pattern recognition.
For segmentation, AI ensures accurate cell boundaries even in densely packed tissues, which is critical when analyzing Hyplex data.
AI driven feature extraction allows us to find hidden spatial relationships between transcriptomics and proteomics.
And finally, machine learning models can help identify new biomarkers and predict disease outcomes based on the spatial multilimic data.
One powerful application is in the tumor microenvironment analysis.
AI can integrate transcriptomics and proteomics to classify different immune cell states within a tumor.
This has major implications for immuno oncology, helping us predict therapy response more accurately.
This is a manuscript from Fox Chase Cancer Center where they were looking at pancreatic ductal adenocarcinoma and the immune response in association with cancer associated fibroblasts.
And what’s interesting in this paper was that the fibroblasts that were interacting with immune cells tended to be further away from the tumor than was originally anticipated.
As we push multi omic imaging forward, the ultimate goal is clinical translation.
The ability to spatially map gene and protein expression at single cell resolution has potential applications in pathology, drug development, and personalized medicine. And we will need AI to make sense of these massive datasets in a way that clinicians and research can use for decision making.
For multi omic imaging to actually reach the clinic, though, we need to think just beyond the technology.
First, integration with other clinical data sources such as liquid biopsy and genomic sequencing, will be key. Have that orthogonal information.
Second, standardization is critical, both in terms of image processing pipelines and regulatory approvals.
And third, automation will be necessary to scale these methods for widespread use in hospitals and research labs. At Visiopharm, we think about this with the platforms we develop where Phenoplex has been designed as a platform for spatial biology, where you can look at as many signals as necessary across those multimodal, multi omic panels and narrow down from the large list to the pertinent targets.
Using our discovery platform, AI can be designed and trained to specifically look for those targets and their spatial relationship within different diseased tissues.
Those protocols can be built to be more robust and handle more use cases and understand a larger patient environment where those algorithms can then plug into our decision support tool we call Insight, with those protocols validated and standardized in the clinic. They can also be accompanied by companion diagnostic tests, which will make sure that the samples going into the diagnostic tests are of sufficient quality through quality topics.
Now I imagine a future where spatial multiomics is a routine part of precision medicine, AI driven analysis to help identify patient specific biomarkers, guiding therapy selection in real time. We are moving toward a world where tissue imaging doesn’t just describe biology.
It helps drive clinical decisions.
Multi omic imaging is moving from smallplex to highplex, requiring new integration approaches.
AI is essential for making sense of complex spatial data at scale, and the future is clinical with multiple pathways for translating these technologies into real world applications.
Thank you for your time. Thank you for attending this three part series.
We’d love to hear your thoughts and take any questions that you may have now. Thank you again.
Hello, everybody. Can I just start by saying sorry for the beginning?
You know, a real webinar is not a webinar if you don’t have technical issues. So here it is. But thanks everyone for the excellent presentation.
I think we can go through the q and a and, yeah, have a nice discussion.
So I can see we got a question from Karen Patel.
Does Visiopharm dot detection workflow, use AI or its traditional segmentation methods?
It’s a com a a combination of those two.
Getting some feedback.
Where the dots are detect are detected via traditional methods and cellular objects are detected via AI. So we’re combining those two methodologies.
Alright. Thank you.
Next one from Fergus.
How do you train the membrane aware of object detection?
Do you mark up nuclei nuclei and wholesale objects as separate legal classes for training?
Yes. That’s exactly how we do it. So we can use we can start with our pretrained algorithm for finding nuclei, supplement those labeling methods with, membrane labeling, and then push a train button.
Cool.
And next one from.
Thanks for the talk, everyone. I wanted to know if this method can be used on any form of RNA or DNA. For example, can it be used with tRNAs, sIRNAs, ink RNAs?
Yeah. I’ll I’ll take this one.
So currently, we don’t have one that detects DNA, that’s in the pipeline.
And for RNA, we are also currently working on the short target detection, especially the microRNA and also siRNA. So, again, those are develop in developments.
Cool.
I do have a question for you, Randy.
What are the main advantages of the HCR platform compared to other ish techniques?
I see.
Mhmm. So our technique is very sensitive because due to the robust simplification of the HCI hairpins.
And those hairpins are very small, so it can penetrate the tissues a lot better. So as a result, we don’t need protease digestion.
And the the technology is also faster and cheaper and more cost effective.
Alright. Thank you. Do you guys wanna share something? Any comments about the presentation?
I just wanted to thank the audience, and thank you, Leticia, for hosting.
Yes. Thank you, the audience as well.
Mhmm.
If we don’t have more questions, you can always email us and contact the speakers later if something comes up. And we will be sharing the recording as well. So as you rewatch the session yeah. If any question comes up, you can reach out to us.
I think okay. I just saw one more here.
Are the hairpin methods restricted to certain pluriphers, or can any be used?
No.
As long as it has it complies with the conjugation our conjugation method, then it can be used.
We we have conjugated four force or other happens onto our hairpin.
So, if you want to make sure your four floors can be conjugated, then just contact us at Molecular Instruments.
Alright. Thank you. And Fergus is asking, would you recommend using UNet or DeepLab for forming wholesale objects?
So in the, data that you saw today, I use the UNet, network. So just for those of you that we offer a couple different convolutional neural networks in our platform, UNet being one, DeepLab being another. For the applications you saw today, UNet was sufficient for training the network and and training the AI to to recognize the objects that you saw today. So, but yeah.
Alright. If we don’t have any other questions, I will say thank you everyone for joining.
And you can expect to hear from us with the recording very soon. And, yeah, have a nice day, and thank you, the speakers, for the nice presentations.
Yeah.
Bye.
Ensuring accurate RNA detection within specific cellular contexts is essential for advancing translational research and clinical applications. However, the lack of robust validation of probes targeting newly discovered RNA molecules remains a key bottleneck for clinical translation. Accurate identification of RNA within specific cells, particularly in cytoplasmic regions, presents a significant challenge due to difficulties in determining cell boundaries and ensuring probe specificity.
In this webinar, Molecular Instruments will address these challenges by introducing Dual Channel™ Validation, a novel approach that assesses both the specificity and sensitivity of HCR™ Pro RNA-ISH. This comprehensive evaluation facilitates the translation of high-value RNA-ISH assays from research to clinical settings, ultimately enabling reliable RNA quantification. Additionally, experts from Visiopharm will discuss the integration of their Discovery software, a powerful deep-learning solution powered by AI that enhances the cell segmentation and RNA spot localization, leading to improved RNA quantification especially within the tumor microenvironment.
We will discuss how the combination of protease-free RNA-ISH, co-detection with protein markers, and AI-powered cell boundary recognition unlocks new possibilities for high-fidelity RNA visualization in clinical research. Join us to explore how this end-to-end assay validation strategy can improve the accuracy and clinical relevance of RNA-ISH analyses.
Key Learning Objectives:
- Understand the limitations of traditional RNA staining techniques and how MI’s Dual Channel™ Validation enhances specificity and sensitivity in RNA-ISH assays.
- Learn how AI-driven cell boundary detection using Visiopharm’s Discovery software improves RNA localization and quantification accuracy.
- Explore the power of integrating HCR™ Pro RNA-ISH with Discovery, enabling high-precision RNA quantification within complex tissue environments.
Regan Baird, SVP Research Commercial Strategy Deployment at Visiopharm
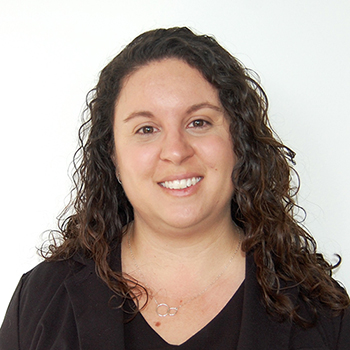
Regan Baird, PhD received his degree from Temple University in Philadelphia, Pa. in Biochemistry and Postdoctoral Fellowship at the Beth Israel Deaconess Medical Center in Boston, Ma. Dr. Baird has spent the past 2 decades in cellular and tissue imaging and analysis. Dr. Baird is currently Visiopharm’s SVP of Research Commercial Strategy Deployment. Talk to him about the practical aspects of AI, Machine Learning, Deep Learning, Tissue Multiplex, and Clinical Integration.
Dan Winkowski, SVP Research Commercial Strategy Deployment at Visiopharm
Dan is a senior technical specialist in image analysis, supporting the US sales team for Visiopharm. He was trained as a neuroscientist and has spent over a decade in academia, specializing in advanced imaging methods and designing automated digital image analysis workflows.

Randy Chen, Director of R&D at Molecular Instruments
Randy is the Director of R&D at Molecular Instruments. He joined MI as a scientist and led the development of HCR™ Pro RNA-ISH protocols for major automated platforms, including the DISCOVERY ULTRA, BOND RX, and ONCORE Pro X. His work has enabled seamless integration of HCR™ assays into biopharma and academic workflows. Currently, Randy is focused on advancing next-generation HCR™ products and expanding the technology’s applications into the clinical space.