Transcript
Thank you so much for inviting me. It’s a pleasure to be able to tell you about our work.
And today, I’ll talk about histopathological scoring of nonalcoholic fatty liver disease using deep learning. And this is a project we did in collaboration with the Visiopharm. But first, a few words about Gubra.
So we are an independent, biotech company doing preclinical research.
We were founded in two thousand and eight and located in Hoersholm, Denmark.
And we are one hundred and sixty five employees, and we have two hundred customers worldwide.
We work within NASH, obesity, kidney, heart, diabetes, and the CNS. And we do both, zero services and have our own, target and drug discovery programs.
But today, the agenda is on NAFLD.
So I’m gonna talk a bit more about what, nonalcoholic fatty liver disease is and how it’s diagnosed, and how we use the deep learning applications to evaluate the diagnosis, and how we validated the deep learning applications.
And then I’m gonna end with a data example.
So first, what is a nonalcoholic fatty liver disease? It’s quite a wide spectrum, starting with type one where you have, lipid accumulation in the liver, also known as, steptosis.
This can then progress to type two where you have steptosis plus inflammation.
Type three and four are called NASH for nonalcoholic steatohepatitis, And type three has, hepatocyte injury, also known as ballooning degeneration.
And in type four, you will also find fibrosis.
Type four NASH can then, further lead to cirrhosis, which is lethal.
And the prevalence in the United States are twenty five percent actually, and this is mainly due to type two diabetes, western diet, obesity, but also other factors.
And twenty five percent of these will progress into NASH, and again, twenty five percent of these will develop cirrhosis.
So how is, how is, NAFLD, diagnosed?
For that, you need a liver biopsy.
And when you look at this needle biopsy, which, is HNE stain, and you zoom in, you will see lipid accumulation and, and in, inflammation.
So what we really want to do is look at the, these parameters, using deep learning rather than a histopathological, evaluation in the microscope.
And of course, this is because we wanted it to be unbiased and quantitative and consistent.
And so and so to to go for this scope, you need to understand, the how, you define the different stages of the disease. And for that, you use the CLINIS score also called NAFLD activity score or NAS.
And the first component of the NAFLD activity score is stertosis.
So, to score stertosis, which ranges from zero to three, you evaluate how many of the hepatocytes contain a lipid droplet. And if it’s less than five percent, it’s a score zero, five to a thirty three is a score one, and so forth.
So to do this as deep learning, you need to be able to recognize, hepatocytes with and without a lipid droplet, and to count them and and do the percentage.
The next component of the score is lobular inflammation, and when the pathologist looks at, evaluates the lobular inflammation, they look in twenty x field of view and they count the number of foci.
And a foci is defined as at least four inflammatory nuclei close together.
So to be able to do this in, using deep learning, you need to both look at, identify the inflammatory nuclei, define when they form a foci, and define the distribution, because the score for the score three is more than four foci in in, in a field of view. So you cannot simply count them all. You need to also find that distribution.
The final component of the NAFLD activity score is ballooning.
And ballooning is characterized by these swollen cells with a degenerated nuclei.
The cytoplasm is empty. The lipid droplets are gone. There can be malignant bodies.
And basically, they have a special morphology that you can train, deep learning app exactly the same way as we do for the other nuclei.
And the the scale is fairly simple. It goes none, few, many. So I’m not going more into the ballooning, app today, but you’re welcome to contact me if you want to know more.
So I’ll, show you the final workflow first. So we call it the GHOST workflow.
GHOST standing for group has a pathological objective scoring technology, so the whole app package.
And it starts out by, tissue detect excluding the capsule.
And then, using deep learning, we identify the central veins and the portal triads to be able to exclude them from the NAFLD activity score and also enables us to do, a portal inflammation score, if we want on top of the NAFLD activity score.
Then we have a high magnification, or twenty x deep learning based app. It’s trained on the unit.
And this one, detects all the nuclei we want for the that we need to to, to do the score. So it’s hepatocytes without fat in green, hepatocytes with fat in blue, and the inflammatory cells are yellow, and then, the definition of a foci is outlined in orange.
So based on these nuclei segmentations, we can run a whole set of post processing apps, to calculate, the scores. And for inflammation, the overlay looks like this.
So we divide the biopsy into areas the same size as the field of view for the pathologist, and then we count the foci inside, each square. And here here you see that the red square is a score three, the orange is a score two, and, so forth. So you can also get an idea of the, inflammation distribution by looking at the overlay.
But how did we do it?
There is, of course, a lot of nuclei segmentation and evaluation, to get to the stage where you trust the, all the overlays and numbers that you get out of the app.
And here you just see, an h and e stained, Nash liver from a mouse, which is how it typically typically you, looks like. And then we do manual annotations, hepatocytes with and without, steatosis and inflammatory cells.
And just to give you an idea of the workload, here you have the number of annotations used for for this, for this app. And, of course, the numbers are quite high because these nuclei are really difficult to to distinguish, from each other. And also there are nuclei that we don’t want in the analysis such as, Biodog, for example. So so it’s not an easy deep learning task, and, other apps would definitely maybe require fewer annotations, as was the case, for example, for the central veins and the portal trails.
But then, you train and evaluate, and then you get, we got the overlay looking like this.
And then to test if we were satisfied with the app overlay, we merged the two images.
So here you have, the outline is the manual annotation, and then the overlay is the app. And then for each pixel, you can calculate, how well they overlap.
And the calculation is called the dice coefficient, and you don’t need to go into this. It’s true positive pixels, and then you have the false positives and the false negatives.
And if you have no false positive or false negative pixels, it’s all perfect, then you get a dye score of one.
So we get a dye score of zero point eight or more for all our, for our three labels, and we are super satisfied with this.
Also, we because we need, to count these nuclei and the the discrepancies between the app and the manual annotations are mostly in the border of the of the nuclei, and doesn’t make a difference to us, for the further post processing. So we are super satisfied with the this final result.
But, of course, you also want to know, how the app performs on the level of the final score.
And for that, you can do a plot like this where you see, for example, here we have the manual scores on the y axis and the ghost score on the x axis.
And then if, for example, score three, you have, eighteen, manual score threes. And then you see how the app performs, twelve times it’s a score three, two times it’s a score two, and four times it’s a score four, and so forth. And you see how the scores align, here in the diagonal.
And then you can count the Cohen’s kappa to see, how much, the histopathologist agrees with the GO score. And we end up with a Cohen’s kappa of zero point seventy two, which we’re super happy about. It’s comparable to when we compare two histopathologists to each other or, yeah. And then and and then it’s consistent and unbiased and, we’re ready to move on.
And the really cool thing is that, we also get these supportive quantitative metrics, the actual percent of the hepatocytes with lipid droplets and the actual number of inflammatory cells and foci.
And, these numbers produce you’re you’re able to do stronger statistics and, and get and be able to pick up smaller changes in your, in your data.
So now for the data example.
So here, first, you see the study outline.
So we have mice on a GAN diet, which induces obesity, and then over time, so thirty eight weeks, they also develop NASH, most of them.
And to confirm the NASH diagnosis, we do a liver pre biopsy, four weeks before the study begins.
We, use this liver pre biopsy to exclude, animals with a stethosis score below two and a fibrosis stage below one.
And then we use the fibrosis to randomize the animals.
Then we have the in vivo period, so it’s twelve weeks of chronic repeated treatment.
And then we do termination and take the liver post biopsies.
And we do a whole, histology package. But for today, I’ll focus on the NAFLD activity score, looking at the pre to post, changes in the NAFLD activity score.
And the groups included in in the study is, lean chows, so healthy lean mice receiving vehicle. And then we have a diet induced obese NASH mouse receiving vehicle. And we have the diet NASH mice receiving semaglutide.
So semaglutide is an antidiabetic drug used for type two diabetes, which is also useful, for NASH. It’s not perfect, but, there’s no perfect drug at the moment, unfortunately.
So here you see the representative h and e images. You clearly see the difference between Chao and Thio Nash with lots of lipid accumulation and increased inflammation.
And then, you see the semaglutide group somewhere in between.
So then here we have an overview of the collected NAFLD activity score, so the combination of stethosis inflammation and ballooning.
And, you see the pre to post changes. So the dark gray is no change, blue is getting worse.
The light gray is one point improvement, and the green is two point improvement.
And you see in the Diana’s vehicle that some animals improve and some, gets worse.
And then you see in the semaglutide group that more than half have a two point improvement and almost all have a one point at least one point improvement.
So you have a significant improvement of the NAFLD activity score using the semaglutide.
If we then split these scores, into individual NAFLD activity scores, you see that the that the chows are zero and that dinosaurs, animals are around a score of six to seven, when they enter the study, and then you see the changes during the twelve weeks of treatment.
Then we can split up the score into the different components. And here you have the stethosis score. See, a few dialysis vehicle improving, but, all, all semaglutide animals, improve and half of them improved by two points, which is also what you see, looking at the individual scores that all the dianized animals were a three when they entered the study, and, all the semaglutide improved.
And you have no stethosis in the child vehicle.
But then, these extra metrics, you can actually count how many hepatocytes have a lipid droplet, and you see how the the iron ass have sent seventy five percent, and then it’s reduced to these, thirty to forty percent in the semaglutide group.
Then we come to lobular inflammation.
Here the picture is a bit more mixed. You see how both the iron ash and the semaglutide, have quite some animals improving and a few animals worsening.
And it’s not unusual, for the DIANASH to have some animals that will experience regression in the inflammation.
This is kind of the disease cause that inflammation goes a bit down and then fibrosis takes over, in the later stages of the disease.
And unfortunately, there is no difference between these groups.
This is just the picture. And it’s the same when you look at the individual inflammation score. You see how they are scored two to three, and that the twelve week treatment, make it make no difference, basically.
But then we can also count the number of inflammatory cells and, the foci.
And here we see that to the to the left that there are absolutely no difference between the inflammatory cells in the thioness vehicle and the semaglutide group, but there is half the amount in the in the, lean chow vehicle.
And then if you look at the foci, so when the inflammatory cells form these, clusters of at least four, you at least I hope you appreciate that there is a trend that the semaglutide has an effect on, these inflammatory cells forming a foci or not. It’s not significant, but it adds value to the analysis compared to the score where you couldn’t see any difference at all.
So to sum up, deep learning based image analysis, can do NAFLD activity score, comparable to expert manual evaluation.
So we think that is quite an achievement. We’re really happy to finally, be at that stage where we can say that.
It’s for sure been labor intensive, and it requires manual review continuously, especially when you introduce new drugs in the in the in the experimental setup or if you change any experimental settings because, you need to make sure that that that the app can recognize all the tissue changes. So it, of course, it the overlay will go wrong if if a new, if new phenotypes arise.
But then with that set set, we get an unbiased evaluation.
It’s consistent, and we have these extra metrics.
And, I can say on behalf of all the the people working with this, at Gupa that we find it, really nice to work with and superior to the to the manual evaluation. And, yeah, we’re we’re just super satisfied to get to this point.
And if you have any questions, please feel free free to contact us. We will be happy to answer any questions.
And with that, I would like to thank especially Visiopharm, for the collaboration of this app development. It’s been awesome.
And I want to thank you for listening, and I’m open to take questions.
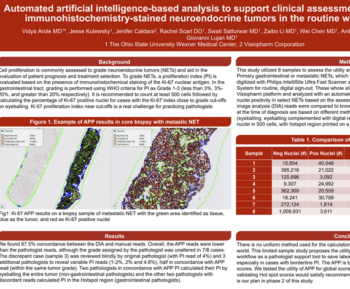
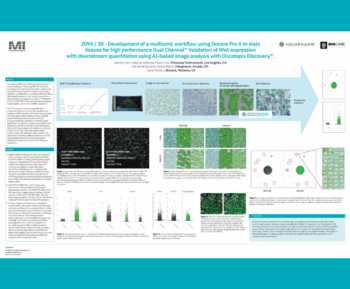
Introduction: Liver biopsy is the gold standard to diagnose non-alcoholic Fatty Liver Disease (NAFLD) and the more progressive form steatohepatitis (NASH), and is the primary outcome in clinical trials for NAFLD treatment. The diagnosis is confirmed using the histopathological NAFLD-activity score (NAS), which grades the severity of steatosis, hepatocellular ballooning degeneration, and inflammation. Histopathological disease scoring systems are, however, subjective and prone to inter- and intra-observer variation. We therefore apply a deep learning image analysis strategy to obtain a more accurate and objective method for staging NAS in mouse models of NAFLD.
Materials and Methods: Using the Artificial Intelligence (AI) Deep Learning software from Visiopharm, the strategy was to perform a segmentation of liver biopsy sections stained for H&E from diet-induced obese (DIO) NASH mouse models and chow-fed controls. Inflammatory cells, lipid droplets, ballooned hepatocytes and hepatocytes with and without steatosis were annotated in H&E sections. Moreover, central veins and portal tracts were annotated. Thereafter, segmentations were postprocessed into the corresponding histopathological scores, and in addition quantitative measures of inflammation and steatosis were obtained.
Results: AI Deep Learning applications successfully recognized inflammatory cells, hepatocytes with and without steatosis, and ballooned hepatocytes in DIO-NASH mice. The app performance was comparable to manual evaluation of NAS, and confirmed significant improvement of NAS after 12w treatment with semaglutide in a DIO-NASH mouse model.
Discussion and Conclusion: We here demonstrate a deep-learning based approach to obtain the NAS scores in translational obese mouse models of DIO-NASH. A deep-learning approach for pattern recognition allows rapid and reproducible quantification of histological NASH parameters.

Agnete Overgaard, Research Scientist, Gubra
Agnete Overgaard has worked with Gubra for the past three years as a research scientist in the Tissue Research department. In this role she is responsible for processes ranging from optimizing protein and mRNA visualisation in tissue preparations, all the way to image analysis and histopathological evaluation of biopsy preparations from Gubra’s diverse animal models. Gubra is a biotech company that offers contract research services within the metabolic space, including extensive histology data packages. Over the years she has been involved in digitalization of workflows from biopsy to graph, including the development of several new image analyses. Recently, she was involved in the development of deep learning-based histopathological scoring of non-alcoholic fatty liver disease, that enables objective evaluation along with quantitative outputs.
She was previously a postdoc within the neurobiology field at University of British Columbia and Copenhagen University Hospital Rigshospitalet, and she holds a PhD in Neuroscience from the University of Copenhagen.