
How HistologiX answers complex biomarker questions in drug development
As multiplex and spatial biology become increasingly important in translational research and drug development, the ability to turn complex datasets into meaningful biological insights is critical.
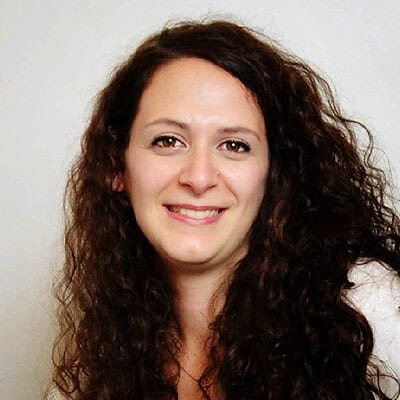
We spoke with Cristina Suanno, Head of Image and Data Analysis at HistologiX, about how her team uses Phenoplex™ to answer complex biomarker questions and help sponsors make more informed development decisions.
Cristina Suanno is Head of Image & Data Analysis at HistologiX, where she leads the development and delivery of quantitative image and data analysis services for preclinical and clinical projects. She holds a Bachelor of Medicine and Surgery from the Università degli Studi di Ferrara, followed by a Master of Research in Molecular Pathology, Bioinformatics and Diagnostics from the University of Nottingham.
During her studies and throughout her career, she has developed extensive expertise in digital pathology and quantitative image analysis. Cristina now leads a multidisciplinary team of research and data scientists, who develop workflows for chromogenic and multiplex immunofluorescence studies. The team’s expertise spans from tissue segmentation, cell phenotyping, spatial biology and statistics and support pharmaceutical and biotechnology clients from early discovery through to clinical development.
About HistologiX
HistologiX is a GLP- and GCP-compliant, ISO 9001:2015 accredited CRO specialising in tissue-based biomarker analysis. Through a tailored combination of histology, immunohistochemistry, immunofluorescence, in situ hybridisation (including RNAscope™ and BaseScope™), pathology, advanced image analysis and data science, HistologiX generates quantitative data that help clients understand how drugs and devices influence key biomarkers at both the cellular and tissue level. Expertise includes regulatory testing, development and characterisation of monoclonal antibodies, cell therapies, oncolytic viruses, medical devices and small molecules, as well as regulatory Tissue Cross Reactivity (TCR) studies for therapeutic antibodies and antibody-like molecules.
Biopharma teams are increasingly adopting multiplex and spatial biology approaches. What challenges do sponsors face when trying to extract meaningful insights from these datasets?
mIF generates an enormous amount of information. The challenge is no longer generating the data; it is interpreting it and putting it into a biological context that makes sense. To do so, you need the right expertise.
Our team brings together biology, pathology, image analysis and data science, so we can look at the study from all those perspectives.
Our lab scientists can generate robust assays and high-quality images, Visiopharm can perform pretty much all types of analysis, the real value is in bringing all of that together, and that is something not everyone can do.
When sponsors approach HistologiX with complex biomarker or translational research questions, what are they typically trying to understand?
This is probably the most exciting part of a study, deciding which questions we should be asking the tissue and sometimes sponsors don’t know how much information you can get out even from a simple 8plex.
It is rarely just about prevalence anymore. Take a mIF assay, its value is not simply that it measures more markers. It is valuable because it preserves spatial context. So why not explore that further? Even when a sponsor initially asks for a simple positive cells quantification, we often encourage them to think more broadly because there is usually much more information in the tissue.
With Phenoplex, we can help answer questions such as:
- The Who – Which cells types are present?
- The Where – Is the target expressed where it’s supposed to be?
- The When – Does the TME change following treatment for example?
- The How – How are cells organised, are neighbourhoods or clusters changing?
Once we answer those questions, the biology and study background then can explain the why.
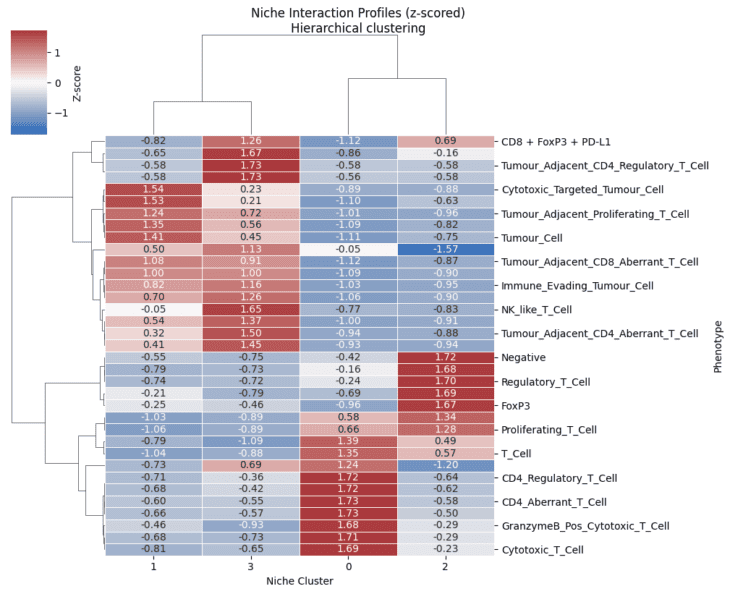
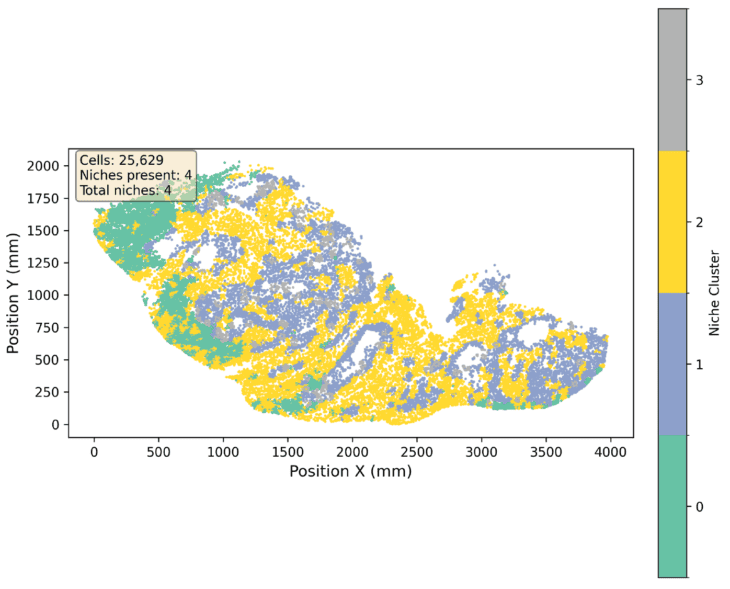
Following phenotype classification in Phenoplex, neighbourhood analysis is used to identify which cell populations tend to occur together within the local niches. The heatmap compares the cellular composition of these neighbourhoods, revealing distinct patterns of immune and tumour cell association across the TME.
How does Phenoplex fit into your workflow when addressing these questions?
Phenoplex gives us an end-to-end workflow for multiplex analysis, although, to be honest, we also use it for some single-plex studies during algorithm development.
One of its biggest advantages is how visual it is. You can immediately see whether your cell classification is performing well and the Explore and QC modules make it very easy to identify outliers. QC becomes part of the analysis rather than something you only review at the end.
We act as an extension of our clients, so being able to trust the data is key for us as much as it is for them, which makes QC particularly valuable. We need to distinguish genuine biological outliers from algorithm caveats and limitations. Sometimes an outlier means the analysis needs refining; other times, it is telling you something biologically interesting.
Phenoplex helps us spend more time interpreting the biology and less time managing a complex analysis workflow.
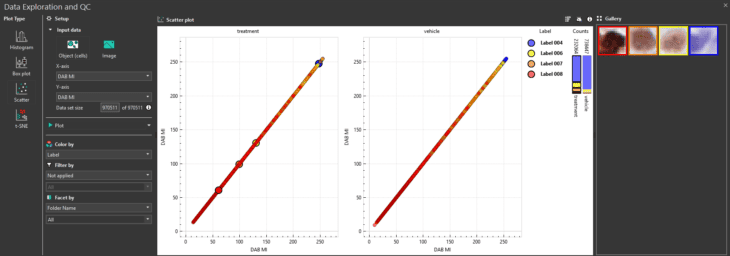
The Data Exploration and QC module is used to review algorithm performance and identify potential outliers across a dataset. In this chromogenic study, treatment and vehicle groups are compared, while weak, moderate and strong positivity classification is assessed (Label 4, blue, Negative cell; Label 6, yellow, Weak cell; Label 7, orange, Moderate cell; Label 8, red, Strong cell).
Can you share an example where HistologiX used Phenoplex to help answer an important drug-development question?
Sure. A recent study involved the investigation of a number of TAA in a specific tumour type.
Rather than simply reporting colocalization and phenotype counts, we used Phenoplex to quantify the populations within tumour and stroma compartments and then looked at how they were organised spatially in the tissue.
While the overall prevalence of some markers did not change very much, their colocalization and spatial organisation in particular foci of the tumour changed considerably. That was not obvious from simple cells counts alone and when these results are combined with patient metadata, these are the findings that generate the most interesting biological discussions when the dataset is returned to the sponsor.
Have you used Phenoplex to help sponsors better understand how a therapy is affecting the tumour microenvironment?
Absolutely. We usually work with sponsors from the study-design stage, thinking about which biomarkers are most appropriate for the questions they want to answer. That means sitting down sponsor and HistologiX lab scientists, IA scientists and data scientists all together to understand the study background.
We have extensive experience working with pre- and post-treatment sample sets, including clinical trial samples. Phenoplex is the perfect tool to quantify changes in immune populations, assess co-expression and explore spatial relationships such as immune infiltration, proximity and neighbourhood analysis, or distance from vessels and tumour margins.
Technically, these analyses are relatively straightforward in Visiopharm, and once you begin visualising the data with timepoints and samples metadata, treatment related patterns get revealed.
Beyond generating high-quality data, what impact can these insights have on a sponsor’s development programme?
Ultimately, you do not know what you do not know, and sponsors need good data that allow them to make informed decisions.
They will often come to us with a list of predefined outputs, and Phenoplex handles those very well. But because we like to think outside the box, and because Visiopharm is the perfect ally for this thanks to its flexibility, the most exciting part is often when we go beyond what was originally requested and explore the biology in more depth. That is where unexpected findings can emerge, and spatial analysis is particularly useful for uncovering hidden patterns.
Image analysis is a sort of scientific storytelling, Phenoplex helps us reveal the biology, and we bring it together through clear visualisations and robust statistics, so that sponsors can truly understand the data they have in hand. I think that’s the real value image analysis brings to a project. To me, that’s the real value image analysis brings to a project.
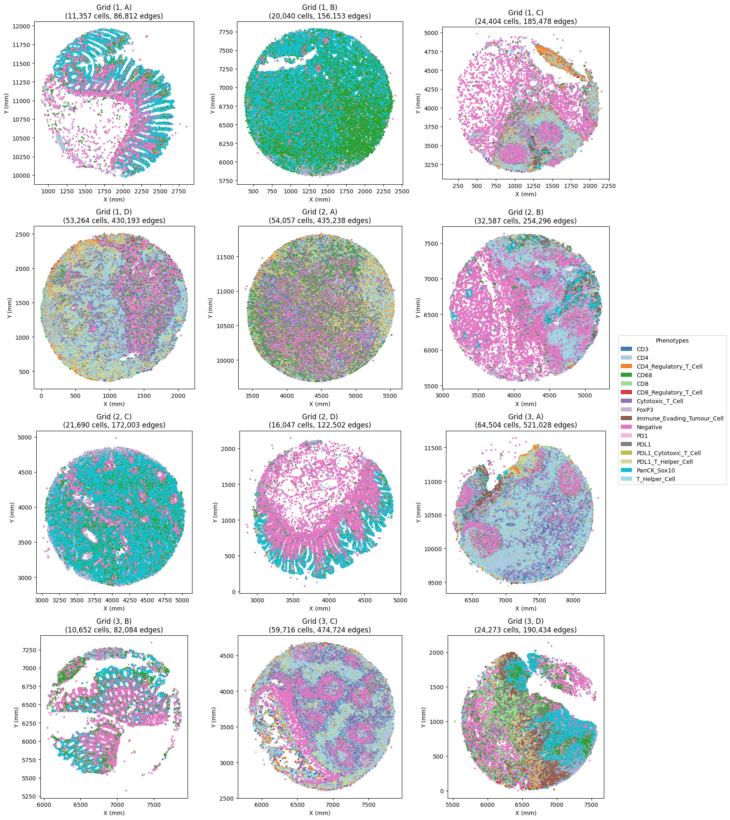
Cells are classified into phenotypes based on marker expression and mapped back to their spatial location within each tissue sample. This allows differences in phenotype and tissue organisation to be compared across samples while retaining the original spatial context.
What role does reproducibility play when generating data that may influence development decisions, and how does Phenoplex help support this?
Reproducibility is absolutely fundamental. If you cannot reproduce the analysis, you cannot have confidence in the conclusions.
Because HistologiX also have a full wet lab, we are often asked to assess assay reproducibility, and IA naturally becomes part of that validation process.
We have used Phenoplex together with statistical analysis to validate assays for clinical-trial use and assess batch-to-batch variability. Applying the same analysis workflow across batches allows us to determine whether observed differences reflect true biology, assay variation or analysis variability. That gives both us and the sponsor much greater confidence in the final data.
Contact HistologiX to learn more about their digital image analysis services.
Are you curious to hear more about our multiplex software? Contact us here for more information.
Share this article