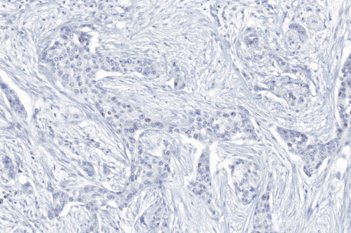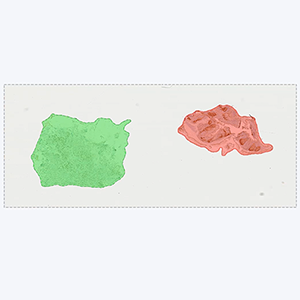
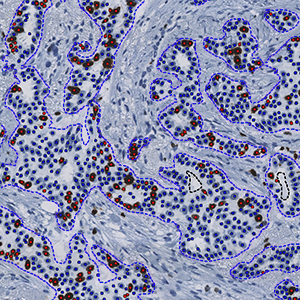
Tissue detection
Detection of sample tissue and exclusion of control tissues.
#10004
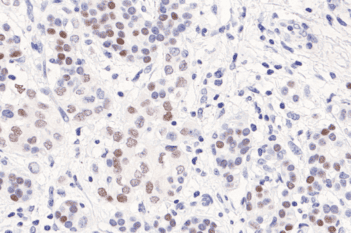
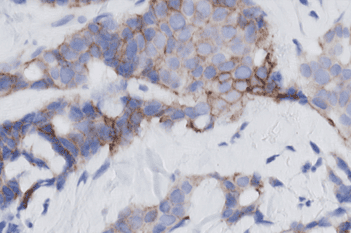
The Ki-67 protein is associated with cellular proliferation and can be assessed by Ki-67-immunohistochemical (IHC) staining.
Our Ki-67 solution is fully automated and does not require manual input during analysis. The solution consists of four automated analysis steps. Once started, it automatically separates the sample tissue from control tissues and robustly identifies invasive cancer areas in the sample. Tumor nuclei are counted based on their Ki-67 expression and the resulting proliferation index for the whole tumor area is calculated.
Tissue detection
Detection of sample tissue and exclusion of control tissues.
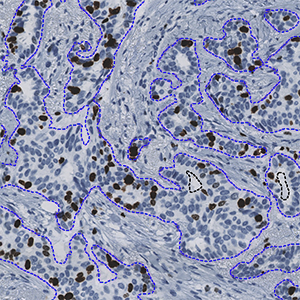
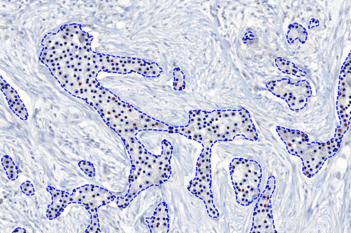
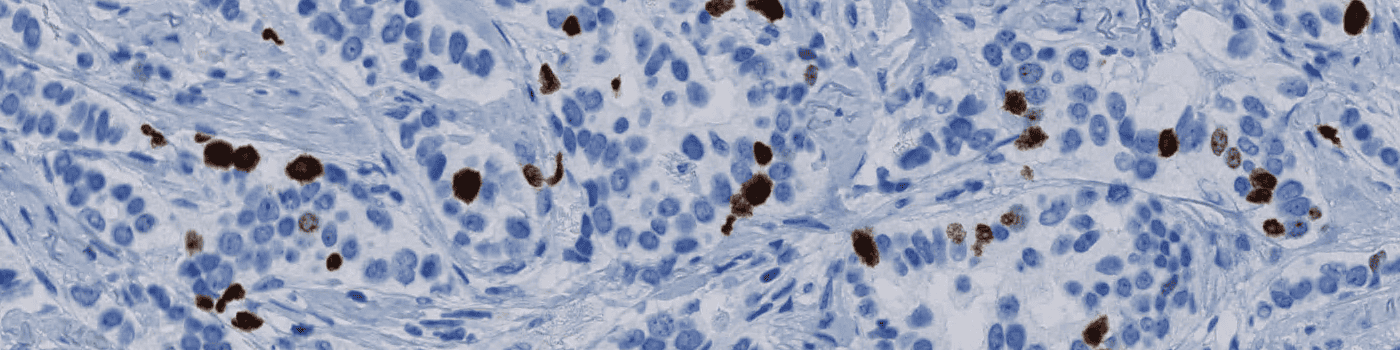
Invasive tumor detection
Automatic detection of invasive tumor tissue or manual outline of tumor region directly on the Ki-67 slide.
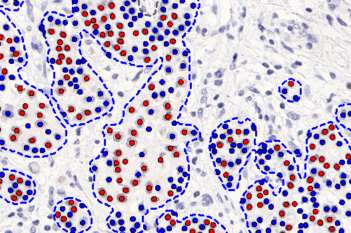
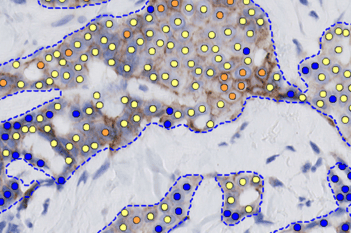
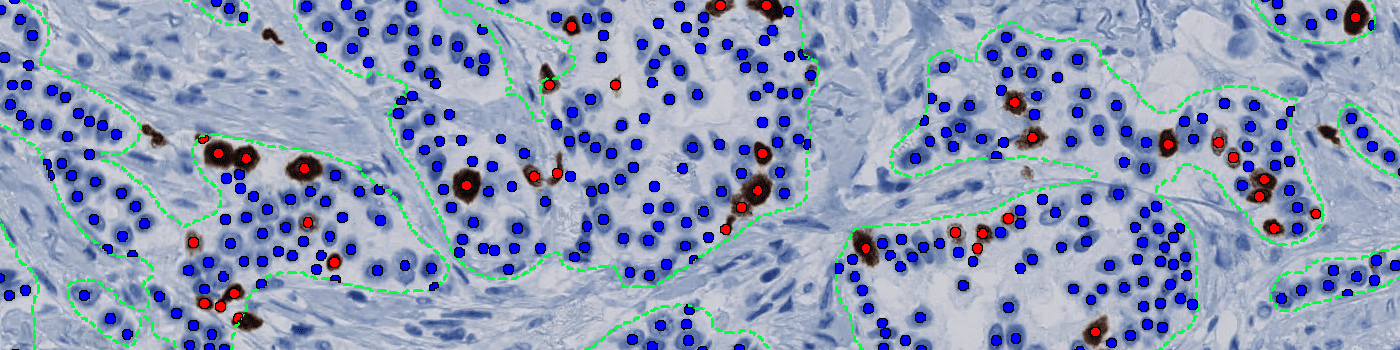
Ki-67 – nuclear detection
Nuclear detection with classification of positive (red) and negative (blue) nuclei based on Ki-67 stain. Techniques ensure un-biased counting during the detection of nuclei1.
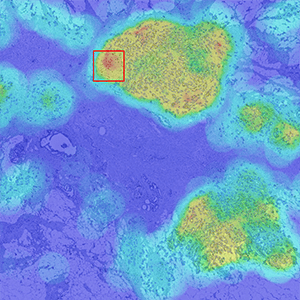
Hot Spot & Heat Map
Optional visualization of the proliferation distribution and identification of a customizable hot spot (here shown as a red square).
Quantitative Output variables
The output variables obtained from this protocol are:
Workflow
Step 1: After scanning, the IMS informs the Visiopharm software about the new image and the analysis of the image is automatically started.
Alternatively, the analysis can be started manually by opening the image and starting the analysis.
Step 2: Pathologist review the analyzed image. If needed, adjustments can be made.
Additional information
Compatibility
The solution works with stains from Agilent, Roche, and Leica. It can be applied to ductal or lobular breast cancer samples.
References
1. Howard, C.V., Reed, M.G. (2005). Unbiased Stereology: Three-Dimensional Measurement in Microscopy. QTP Publications.