Transcript
I’m gonna talk about sort of two topics today related to biomarker discovery with high high-plex Imaging.
Before I start, even though many of you probably got all your CME that you need at this conference already, you’ll get it in the next couple days, And this is not CME. I still feel it’s important to show our disclosures.
And, I have a lot of them. As you can see, I talk to a lot of people. And, these companies all support work in my lab.
And so I don’t like to consider these conflicts of interest. I consider this confluence of interest because a lot of the stuff I do in order to affect patient care as an academic, I need a business partner. And so many of these are actually business partners as opposed to conflicts of interest.
I wanna talk about three topics, the two topics.
Before I talk about high-plex discovery, I wanna talk about how we measure tissue or how we measure protein on slides because that’s the, you know, sort of the bottom line about what we’re doing when we do quantitative imaging or even non quantitative imaging, any kind of immunohistochemistry, is we’re measuring protein on slides. And so we have to think about how we can measure protein on slides to best understand those measurement techniques. And so this is just a cartoon, a crude cartoon, but it’s a good way to sort of think about how we measure on a slide. This is a field of view. And then we have some cells that express a marker, and they express that marker x at various levels.
So if they expressed a lot, it’s dark. If they express a little or none, then it’s light.
And so there’s two ways to do that. One is to count is to make a threshold and say, okay. I’m only gonna count the cells that are greater than fifteen percent intensity and then count those up. And so then if that’s the case, fifteen percent, then you’d have fifty percent positive cells.
That’s one way to think about it. Another way to think about it is I wanna measure everything in this field of view and give you a measurement as if it were a concentration or if it was a blood glucose or a sodium or something like that. And to do that, you have to have a denominator. So the denominator is the field of view or the denominator can be a subset of just the cells in the field of view and then measure the intensity in each of the cells.
Many even know this as an H score, which is how you do it subjectively. But I think in the new millennium here, not even in the twenty twenty’s, the new decade, it’s time for us to become quantitative. We’ve been quantitative for ten or fifteen years, but it hasn’t caught on very well because we didn’t have to be. And now with immunotherapy being a new whole new modality, I think we’re gonna really have to be quantitative.
So the definitions that I just described to you were counting, which requires a threshold, which is what I described, in this case, fifty percent. Then you just count. And at the end of the day, you have counts per square millimeter or percent cells positive. And that’s the most common parameter that we use because we can estimate that, or we can use a machine to actually give us the actual number of cell counts per square millimeter.
The measurement, which I talked about, is a little bit of more complex concept. But in some sense, it’s the same way we measure blood glucose or sodium where there’s a denominator and a numerator. And in this case, instead of mgs per ml, you have picograms of target per milligram or microgram or picogram of total protein or intensity units per field of view. And so we can sort of express that as a numerator and denominator and almost like a true concentration.
So I’m going to talk about both of those. And mostly, what we do with Visiopharm is the former threshold and count, which requires cell segmentation.
The other method that I’m going to describe to you today is using the technology generated in our lab, so called the aqua method, which is a per field of view. And so you can see what we’re doing for the AQA method is we’re defining regions of interest by protein expression of cytokeratin, in this case, for where it’s where there’s tumor and where there’s not tumor. And then we dilate and fill. And that gives us a compartment or that gives us an area which is defined by another marker. So a nucleus, when you define when you’re trying to make a measurement, a nucleus is not a round thing. A nucleus is a DAPI positive pixel. Then you sum up all the DAPI positive pixels in the field of view, and that gives you your compartment area.
Whereas if you’re trying to measure something, like in this case estrogen receptor, the amount of intensity of the signal is how you come up with ultimately what what is an AQA score or what is ultimately a concentration. So sometimes we need to use I sort of would wanna just define a few terms upfront because when we talk about target, that’s the raw image of the marker with the full dynamic range, and it’s not image manipulated or filled. Whereas we cut a compartment, that’s the binarized threshold pixel value so that you can know what your denominator is. And then a mask is just a region that you might fill or dilate to tell you a region of interest.
And so those are kind of the nomenclature we use when we’re doing measurement. When we’re doing counting, we have to segment the cells. And so I’m sure that, many of you could and certainly, my the speaker who’s next will do a better job perhaps of talking about Visiopharm’s method for segmentation. But I can tell you what we do in our lab, which is, a segmentation based on nuclei and then the area around the nuclei and ultimately counting the number of segmented objects.
The segmented objects are the cells, and so you can get cells per millimeter. Now with things like lymphocytes and things, this works great. And in fact, I’m gonna show you some examples of of how we do this. We’ve we’ve also do cell counting, in our lab with the InForm software where you’re you prepare the image, you find the tissues, which is kinda like a mask, but it’s a tissue finder where you have tissues.
And then within that tissue, you find the cells or phenotype.
And those are the methods that we use to actually count the cells because at the end of the day, we want to have a cells per square millimeter and actually do some counting. So now, with that in mind, I wanna talk about, a new high-plex some new high-plex technologies, and we’ll focus on one in particular where Visiopharm and my lab have been collaborating.
About six years ago, this paper two papers came out in Nature in the same month. It was actually the month of April, and I was honored to be able to write a editorial about, those two technologies. And this is really NextGen IHC. This is IHC, but it’s not using two or three or four markers or even seven or eight, which we can reach on fluorescence, but it’s using next gen, which means an order of magnitude more. And so, in fact, instead of four or five, you can get forty or fifty with these these technologies. And there were two technologies that were introduced, MIBI or multiplex ion beam imaging, which was one of the papers. And then the other paper, essentially, which came out the same month, was called Imaging Mass Cytometry.
MIBI has now been commercialized by IonPath. At the time, it was just still an experimental, lab device, but it’s now subsequently been commercialized. And the imaging mass cytometry was commercialized by Fluidigm.
So just to tell you how they do the multiplexing, instead of fluorescent channels, they use heavy metals. And they put a heavy metal on each antibody, and then instead of, having only six or eight channels, you can see two things. First of all, you get fifty four channels or as many as fifty four channels if you use this many heavy metals. And then they’re all very narrow, so there’s not a lot of overlap in the spectra when you’re detecting these by mass spec, so you don’t have the problem of spectrum overlap, which we have with quantitative fluorescence. And this is the MIVI machine, the alpha machine here with the inventors, Peter Thompson from, Oxford and then, Michelangelo and his postdoc at the time.
Oh, I’m blocking on Harris’ last name.
And their initial machine and then here’s the beta here’s here’s the actual unit that people can buy, like Memorial Sloan Kettering and and Brigham and Women’s have a have this, actual this device, which is the MIBE quantitative unit. It’s very expensive, and it came out about two years after this device, which we have at Yale. This is the imaging mass cytometer, by Fluidigm. And what you do is you put your slide in here with your all your antibodies labeled, but they’re all labeled with a heavy metal tag, so you put them down all at once. And then the laser comes along and blows them off the slide into a cloud of argon and into this machine, which many of you know as a CyTOF, which is a way of mass spec detection of antibodies on cells as in flow cytometry.
But this part of the machine, is the microscope part, and that’s where you put the slide, And that’s where the laser blows it off. And then there’s actually a little tube between these two machines where you can then count all the tags that you have. And then the software actually maps it back. So you keep that two dimensional image information, and each pixel gives you a piece of information about forty or fifty or however many plex you have.
So that’s what we’re going to talk about next. And the way to analyze this has turned out to be a big barrier to usage because it’s really hard to do. So the inventing group, Bert Bodemiller’s group, had this pipeline where they used Elastic and then CellProfiler, and then they invited a method called HistoCat, which we tried very hard to use. And and we struggled, and we never actually were able to use that very well.
And and Visiopharm came to our rescue, which is why I’m speaking with you today, because we actually use their software, but they tweaked they they’ve modified it so that it can handle instead of just four or five channels or six or eight channels, it can handle fifty channels as we see with imaging math cytometry. We’ve also been experimenting with the aqua planning platform and working with Navigate to try to do aqua analysis on this, and I’m not gonna talk about that today. And then finally, what we did first was just threw up our hands and gave our images to some bioinformaticists who generated the first paper we had in this topic.
But that was and that was great to do. We had a great experience. This was led by Yuval Kluger at Yale. But then after one, you know, they wanna move on and do something else, and it wasn’t easily replicable by our group and by scientists, who wanna who were actually doing the analysis.
So this was the Visiopharm strategy, and I kinda went over that a little bit where they can look at the DNA markers. So three of the we have two or three markers that are tagged to a heavy metal that just represent DNA. And so that can be our nuclear marker. Then we can find the nuclei using a probability map and then do a filter to find cells around the nuclei, to find the cells around the nuclei. The problem with this is that if a cell doesn’t have a nuclei in the plane of section, we can’t see it. But the advantage of it is that we can we can cell count, but now we can cell count and measure essentially by multiplexing within those cell compartments. So it’s kinda combining the two technologies or the two methods that I talked about in the beginning of counting the actual concentration of the protein combined with actually defining the number of cells.
And so here’s how we did how we’ve done this particular this is just an example image where we, we take the TMA spot. So most of what we’ve done on the imaging mass cytometer is on a TMA spot. So that’s our region of interest, but you can do it on a whole field as well. And then you separate you find the boundary to define the cells, then you count the cells, and ultimately you can count.
But then in each of those cells, we can also measure the intensity or how many counts there are of each of these different antibodies. And you can see in our panel, this is our twenty six plex panel that we use for our melanoma cohort. And, to sort of initially just to validate this machine and to validate our ability to use the Visiopharm software as an analysis, I wanna share with you the cohort that we use. So this is a cohort, collected by Pacfei Wong who worked with an oncologist, Harriet Kluger, at our, our institution.
And these are all patients who had not only did they have melanoma that was stage four, but they were, they were treated with immune therapy. So this could give us an interesting platform for discovery for predictors for response to immune therapy. And you can see forty one were treated with pembro, eighteen with nivo, and then fifty eight got ipi and nivo combination. This was pretty much standard of care. And then, Pacfei went to their charts and did the follow-up, and we can see an objective response rate of forty seven percent disease control rate where we counted CRPRNST of sixty nine percent. And then our TMA is a subset of those.
What Pacfei did and what I’m gonna show you next with quantitative fluorescence is he used whole slides, and he was able to show that CD eight, whether using AQA or InForm, was was associated with much better outcome and immune therapy if you had high CD8. So this is not PD L1. We’re just looking at CD8 in the microenvironment, not PD L1 on the tumor cells. And in fact, we see a very high level of of almost a fifty to five to sixty percent long term survival.
Well, compared to about a ten percent long term survival if you had low CD eight. But that’s not that’s where we started. So now we wanna validate that. The first step when I use a new technology is usually validation, and that’s what we did.
So here’s an image from the, from the IMC, the Imaging Mass Cytometer, and this gives you an idea what the images look like. And they don’t look like a microscope image. They they they look a lot more, a lot more granular. And the reason for that is that they’re mapping back to each pixel how many signals from that heavy metal are back in that pixel.
And so you get this kind of granular appearance, but then you can subsection it and you can make images for any of the, markers that you wanna that you’re interested in. So you can see I’m showing you CD four and CD eight. There’s a lot more CD eight cells or positive pixels than there are CD four positive pixels.
Then here’s FOX p three, so we could do TRAGs or things like that. So you can have the combination of multiplexing or the advantage of the combination of multiplexing. In this case, we were just looking at c d CD eight and the CD three compartment, basically. That is we are segmenting and defining cells as CD3 positive, and those we would define as T cells and then look for CD8 in those T cells. And what we can see after we segment that if we look at overall survival, we see the same thing we got with quantitative fluorescence, so kind of validating the technology.
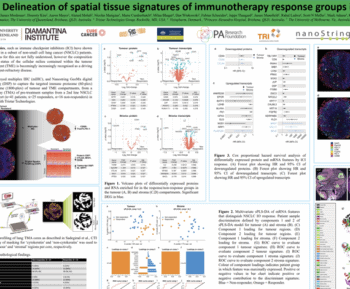
So the next thing I wanna talk to you about is actual discovery. And the actual discovery we’re gonna do in a a cohort, of patients that were breast cancer patients treated with trastuzumab.
And without going into too much detail about the trial, amongst the cases that we have in the trial, again, on a TMA, are a hundred six hundred eighty six patients treated with trastuzumab.
But we’re still pretty early on, so ultimately, we’re gonna look at the whole cohort, and I’ll show you a subset that we look at with IMC in a minute. But what we did is, we’ve actually published this, so if you wanna see this. But what we found in this cohort is that patients that with quantitative fluorescence don’t have any extracellular domain, therefore shouldn’t respond to trastuzumab, don’t have any extracellular domain of HER2. They do worse than the patients that do have an extracellular domain.
So that’s another way we can validate this. When we run the IMC, we ran a panel that has both an extracellular domain antibody and an intracellular domain antibody. Then we can, look for that as a control or as sort of a standardization for the imaging mass cytometry. So here’s the panel we ran on IMC.
And instead of running the whole it’s it’s pretty time consuming and and challenging to run the whole one hundred and eighty cases. So we just ran sixty. We ran the twenty events. That is the patients that recurred on trastuzumab, and then forty random patients that didn’t recur.
So we have a total of sixty spots, and the acquisition time for this was about forty five hours. And we only did a seventeen plexus. This was actually our first experiment. This predated the melanoma experiment.
And what you can see then is we could count the cells and then do a tSNE plot of the the treated and the responders or the patients that benefited versus the patients that recurred. And that’s shown here. This is a tSNE plot. So this is a it’s a combination of what cells are different between them, and and then the expression levels are shown here.
And then you can choose one of those seventeen or twenty six markers in in the case of of this panel that we’re using and then decide where where those cells are localized. And this is not actually an image, but it just shows a the frequency of cells that are are strong or weak. And what you can see is that, and what we’re looking for is a difference, and we’ll validate that in a moment. But the first thing we wanna do is look at something like vimet.
So vimetin should be the same on both the responders and the nonresponders, and you can see that it’s the overall, the map is pretty similar, for vimet. But take a look at this one. Here’s that extracellular domain, and you can see that there’s extracellular domain present at a fairly high intensity in the controls. But all the patients that recurred are losing that that region, you can see.
So they do have some of them have extracellular domain, but there’s this region of loss, which is probably represented by the extracellular domain that’s not present in in those cells that would be mapped to that location on a tSNE plot. So that gives us a little bit of validation that, okay, this is probably working. Then we had another study on a on a different cohort at the time that said patients that have high levels of eGFR are also less likely to respond to trastuzumab, completely different study. But does it apply in this study cohort?
And in fact, that that’s what we found, is that in this study cohort, we also found that patients that had eGFR were present in the event but absent in the control. Some of the cells were absent in the control. There are some cells that are present in both, and they aren’t distinguished by their their eGFR pattern. But now we have to go back, and this is still a work in progress to go back and validate this.
But we’re less interested in eGFR than we are in this. And this is the first time that we’ve ever seen beta catenin as a potential predictive marker for association with response to trastuzumab.
And so you can see in these patients, there’s these in the controls, we have these regions and all these cells that have this sort of vector arrangement in the tSNE plot compared to this region where there aren’t those cells present, making us think that there’s a sub cell type. We’re not sure yet what this is. We’re in the process of validating this. That is not present in the responders that are that’s present in the responders, but is not present in the recurrence patients. And so this is kinda where we are. Just to summarize, that the t s the tSNE plots show the differences between the responders and nonresponders for trastuzumab.
And then we can look at all that those high-plex markers that, were defined by the Visiopharm software to determine which cells are present either in the responders or nonresponders. And so initially, the work confirmed the work of the Neo Alto cohort where we saw EGFR was associated with nonresponders, higher expression of EGFR associated with nonresponders trastuzumab.
And we also saw the extracellular domain absent in the nonresponders, which is what we expected. And then in the preliminary and unvalidated work, it suggests that there’s a subset of cells that have lost beta catenin. And so that’s where we are now. I’d hope to be a little further along to be able to tell you what the beta catenin story is because we really as far as we know, there’s not a relationship between beta catenin or, beta catenin in response to trastuzumab or that’s not yet been described. And so we’re trying to figure out what cell types those are. It’s possible that they’re not the tumor cells, but rather they’re immune cells. And we’re trying to now do colocalization between beta catenin and CD8 and CD3 to see if what we’re seeing is loss of beta catenin or decreased levels of expression in beta catenin in cells in the microenvironment, not just the tumor cells, as a potential mechanism for prediction of response to trastuzumab.
So that’s what that’s, kind of where I wanna go today. I think I’m a little over. I just wanna make sure I I thank the people in my lab who did this work. Sandra Martinez Maria was one who did the IMC stuff, and then the Xin Ang, worked with us to, do the k sixty seven and make the cell lines along with, Reagan Fulton at Array Sciences and then Reagan Barrett and Ben Friberg at Friberg at Visiopharm.
So, here’s the group and our our lab website if you wanna find out more about what we do. And thank you very much.
Find out why Dr Rimm’s work suggests that a subset of cells that have lost beta-catenin expression may be associated with non-response. In this seminar recording from USCAP 2020, Dr Rimm explains how you can benefit from exploratory analysis using AI-powered phenotyping.
Learn how his group used Visiopharm AI-based software to help them get meaningful results from next-gen imaging technologies like Fluidigm’s IMC.
-
- Methods of measurement –co-localization, compartmentalization, and measurement vs segmentation and counting
-
- How his lab used tSNE plots to show differences between responders and non-responders to trastuzumab

David Rimm, MD, PhD, Professor of Pathology and Medicine (Oncology); Director of Yale Pathology Tissue Services. Yale School of Medicine
David has authored over 400 peer-reviewed papers and holds eight patents. His research lab group focuses on quantitative pathology using the AQUA® technology invented in his lab, and other quantitative methods, including Visiopharm´s phenotyping module.
His projects relate to predicting response to both targeted and immune- therapy in cancer and standardization of those assays for CLIA labs.