Transcript
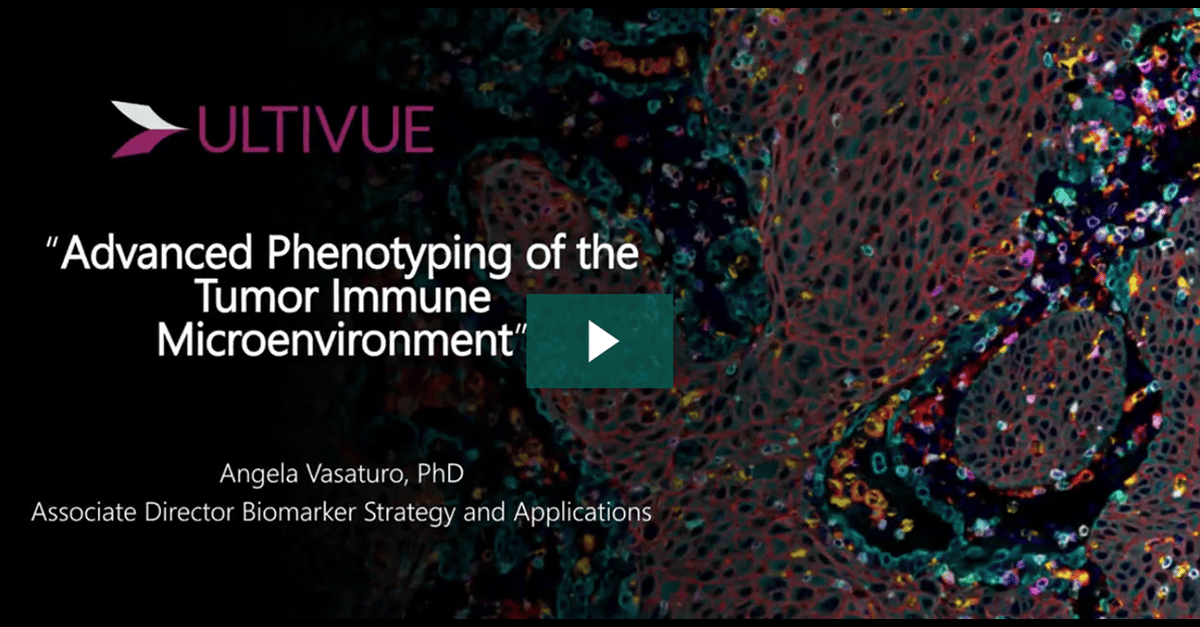
Hello, everyone, and welcome to today’s webinar, Advanced Phenotyping of the Tumor Immune Microenvironment.
I am Jennifer Woods of LabRoots, and I’ll be your moderator for today’s event.
Today’s educational web seminar is presented by LabRoots and brought to you by Ultivue.
To learn more, visit ultiview dot com.
We encourage you to participate today by submitting any questions you may have during the presentation.
To do so, simply type them into the ask your question box and click send.
We’ll answer as many questions as we have time for at the end of the presentation.
You may also submit any technical issues here as well if you have trouble seeing or hearing the presentation.
I’d like to now welcome our speakers, Dr Angela Vasaturo, Associate Director, Biomarker Strategy and Applications, and Dr Fabian Fabian Schneider, R&D and Product Management at Visiopharm.
Dr Vasaturo, you may now begin your presentation.
Thanks for the kind introduction, and good afternoon, everyone. Today, I’d like to start with a quick introduction on the, tumor immune microenvironment.
As you can see in this very elegant representation, the tumor microenvironment is extremely complex. It not only consists of tumor cells, but also many other different self populations, including, cells of the innate and adaptive immunity that play an important role in especially response to therapy. And it’s actually this complexity that drives the need of using multiplex immunohistochemistry that allows the analysis of multiple immune cell phenotypes and, their spatial distribution and interactions.
Multiple XIHC becomes also critical when, working with, very precious clinical samples, trying to provide data to make a decision on whether or not to move a drug forward.
So in this context, the selection of the appropriate tissue biomarker coupled with the spatial analysis becomes really key for generating as compelling as possible data for from the very few samples that are available at at this initial stage of clinical trials.
And, this is not always the case. So, data are sometimes, inconclusive, or, the biomarkers that have been selected are not predictive or, simply the assay, shows, not to be reproducible or, is too complex, to to move in the in the path, towards, clinical, development.
So when working with patient material, you wanna make most of the tissue you have. Therefore, you wanna have the full slide analyzed. You wanna be able to, look at the spatial relationships in the tumor microenvironment.
You wanna generate highly consistent data and ideally you wanna combine your, biomarkers of choice with HNE on the same slide. And, HNE on the same slide is extremely powerful, when, trying to, scale to larger studies, but also when you wanna simplify the assay based on promising indications that, the drug works. So when you, when you wanna work with, treating clinical trials and you wanna optimize the, the chances of, being successful, you need to start from the selection of the, of the most powerful biomarkers by testing, multiple competing hypothesis at the same time. This is why, we like to have, up to eight biomarkers on the same slide plus an HME on the same exact slide, to be able to generate consistent data that that are also critical for algorithm training.
Multiplex IHC is often still perceived as a very complex technology and, although the TME, is complex, your assay shouldn’t be. And it is actually the aim of, the InCituplex technology that Altivio has developed that, made really multiplex simple and allows, to go from tissue to data in a one day workflow.
So, the staining is, pretty simple and, takes very short time and allows for whole slide imaging and the very, deep phenotyping and spatial mapping that you will hear about, in the next presentation.
Here, a very quick overview of the In situplex technology that, really follows just a few steps. The first one is an antigen retrieval, only one, that allows the preservation of the tissue integrity and the HNE on the same exact slide where we perform, fluorescent, multiplex IHC.
Then a staining step where we incubate the sample with a mixture of DNA barcoded antibodies followed by an amplification step where the, DNA barcode is, elongated, to allow, more complimentary fluorescent DNA probes to bind in the, last step, which is a detection step. And at this point, your samples are ready to be imaged.
So with this simple technology, there is a complete retention of sample antigenicity and, the morphology of the tissue and the architecture of the tissue is well preserved, that allows, HNE on the same slide and therefore it’s fully compatible with the conventional pathology.
It is also a very high throughput, technology that can be applied across multiple tumor indications without the need of reoptimization.
And, it can be also easily transferred, to, CRO outsourcing partners for, clinical research, implementation.
So this slide summarizes the initial of the offering of the in situplex technology.
Here you see, Ultimapper kits that, are old fourplex kits that include a different combination of markers that allow to explore complex phenotypes, and, allow to answer specific biological questions on the tumor microenvironment.
For example, there’s a kit that looks around, antigen presenting cells, or myeloid suppressor cells or also, activated T cells, regulatory T cells, but also, phenotypes along the PD-1 and PD-L1 axis.
More recently, this standard offering with the off the shelf kits has been extended to an additional kit which is now, an eight plex panel that we call Ultima Pro ImmunoAID that I will focus on in the next couple of slides. But, the LTVR offering has also extended now, to custom assay development. So we have a dedicated, assay development team that, can build your custom panel up to an eight plex, in eight to thirteen weeks in total.
This is an overview of the immuno eight panel that we have recently developed that, includes the main, phenotypic and functional markers for the key immune phenotypes that, are critical in the, tumor microenvironment.
What I would like to, highlight here is that, as for all the other kits and also for the custom kits, the, the panels that we develop, can be applied to multiple indications without need of reoptimizing any conditions. And here you see an example of the immuno eight panel run on, multiple, tissue types, including, non small cell lung cancer, colorectal cancer, and, breast cancer. And, in the next couple of slides, I will focus on the application of the ImmunoAID panel on, colorectal cancer tissue.
So on this slide, you can see on the left side an overview of, a colorectal cancer, tissue stained with the Immuno eight panel and, a zoom on one leader area where you can see, some tumor nests and but also a lot of, infiltrating cells immune infiltrating cells. And now the, immuno aid panel includes markers that allow the, to identify, the key, T cell phenotypes, including regulatory T cells, exhausted T cells, cytotoxic T cells, but also, immunoating tumor cells or immune suppressive macrophages. So it really gives, a lot of information on the dynamic nature of the tumor microenvironment.
And again, based on the combination of different markers including CD3, CD8, CD4, FoxP3, PD-L1, PD-1, CD68, and the cytokeratin, you can, test multiple hypothesis at the same time and identify really the meaningful phenotypes, the meaningful biomarkers that, give clinical utility.
And here I just wanted to show you a couple of examples of the quality of the staining but also of the different phenotypes that you can identify.
Like in this image in this slide, you have, CD3 in green and then you have CD4 in red. So the combination of CD3 and CD4 allow you to identify T helper cells and then if you add FoxP3 in white, in the nucleus, then you will be able to look at the Tregs. And in the in the right panel here, bottom right panel, I have added just the cytoplarity in in cyan to be able to, show where those different cells are located. And as you can see, there are some that are really intraepithelial, so intra tumor and some others that are really between the different tumor nests.
Next.
In in this specific case, for example, I have highlighted the cytotoxic T cells, identified by, the combination of CD3 in green and CD8 in red, but I have also, added on top of it the PD-1 in yellow that, allows the identification of exhausted T cells. And in this case, you can see that most of them are, CD8 PD-1 expressing cells. Again, the cytokine addition to be able to, look at the localization of the different, phenotypes, and as you can see, there are multiple PD-1 positive cells that are located within the tumor nests.
Last, you see in pink here PD-L1 staining, and, its combination with either CD6 C8 in white or, pancytokeratin in cyan, And this allows you to identify really cells that express PD-L1, which are not necessarily only tumor cells but also, can be macrophages.
And in this specific tumor, you you might be able to see in the, lower left panel that most of the PD-L1 is expressed on macrophages rather than on, tumor cells. And in the in the bottom right panel, I have, added PD-1 so that, we can look at the, interaction between PD-1 and PD-L1 expressing cells. And again, I have kept the cytokeratin staining, to be able to look at the the, specific, localization of those positive cells with respect to to tumor.
And with these slides, I I really want to summarize and reiterate the concept of, the power of, using an eight plex assay to test multiple hypothesis at the same time on the same exact tissue section and then select the most promising biomarker subset that are the ones that would give the clinical utility. So, eventually, what you would do is testing the multiple hypothesis by using up to eight biomarkers, but, go down in the number of, plaques, in the number of biomarkers that are really meaningful to your trial and eventually transfer this to your CRO choice and for clinical deployment on a larger cohort. So, although, we, of course, highlight the power of multiplex, we still believe that, ideally, you want to get to the least number of plaques and the least number of phenotypes that are really able to give you the clinical utility that you look for and, that can be easily, deployed in, in a larger study, at the CRO.
And, last but not least, I have mentioned previously in the during the presentation that, we can perform HNA on the same slide where we perform multiplex IF. And, again, this is extremely powerful, and we can do that because of the type of assay we are using that preserves the tissue architecture and the cellular morphology. And this is really not adding a lot of time to your, staining procedure, and it follows the exact same protocol that is used in in pathology labs. But it it is something extremely powerful especially from the fact that, it adds, the, phenotypic and functional, information to to an image that, is what, pathologists look at and, gives them the, morphological features that are eventually driving diagnosis, for example.
So if you look at this image, a pathologist will be, really comfortable in saying what is tumor and, what is stroma, but also it will be easy for a pathologist to to say as well that there are a lot of, infiltrating cells. What becomes complicated, it’s saying what is the function of those cells and if those are exhausted T cells or if they are cytotoxic T cells. So and this is where the additional, IF, data and information come in and, the combination of the two is really, what gives, most what takes most out of a simple tissue that, can be extremely precious.
And, with this, I’d like I’d like to thank you all for your attention.
Thank you very much, Angela, for the great introduction into the IO eight plex and your technique.
My name is Fabian Schneider, and I will show you how the Visiopharm platform can be utilized to decipher all the phenotypes that an IO eight plex or an eight marker, a multiplex assay, delivers.
So in the background, you already see the CRC case on which we will demo, our, capabilities of our platform.
And you already see quite an overlay of markers and, where the cell types are touching each other.
In immuno oncology, the cellular phenotypes of the immune system and markers on the tumor are of utmost importance to understand mechanism of actions of new drugs.
And, for this, we need to understand where are the cell types and the interactions, what are the distributions of these phenotypes that are resulting from the markers, where is the receptor and ligands in the immune cancer synapse, and are they correlating?
I would like to introduce you to the Visiopharm software platform, which is a toolbox for image analysis scientists, in which you can combine the rule based machine learning with artificial intelligence deep learning classifiers.
All your outputs that you would like to generate are fully customizable, and no coding is required from the user.
And we have a lot of modules with which you can extend the functionalities of your platform.
For example, tissue array, in which you can use your tissue microarrays in Brightfield and fluorescence.
You can de array the course and for an individual analysis of each.
We have the multiplex phenotyping, module, which gives you an automated unbiased clustering tool for the analysis of Hyplex data.
We have a tissue aligned module with which you can coregister serially sectioned and stained images across modalities, like IHC and agent e, IHC, agent e, and multiplex IF.
We also have one, product that is called the brain mapper for the mouse brain on which we have a prebuilt atlas with deep learning, classifiers to identify the mouse brain regions, horizontal and sagittals, sections.
And you can, identify the new biomarkers and quantify them within the different regions.
Today’s problem is, the immuno eight plex and the phenotype analysis.
So the first thing that you need to do is you need to segment the tissue into the blue here, the cancer versus the stromal regions.
Then what you would do is you do a second app is, cell detection. So you need to identify all the nuclei, and then you can expand the nuclei into a cell segmentation, and then you can phenotype with the underlying presence of the, of the biomarkers, which will then result into many different classes of positivity for these biomarkers.
And we offer this based on machine learning classifiers, or and we can combine those with AI deep learning capabilities.
And then once you have your cell segmentation, you can run an automated phenotyping with the phenotyping module.
What we have used for the tissue segmentation as well as for the cell segmentation, we have used the AI deep learning classifier.
What you will get out is simple results like, box and bar graphs that you can report the positivity of cells or percentages or densities.
You can show the results also as heat map overlays on the tissue directly to display the the distribution of your phenotypes across the tissue.
Another thing is that you can calculate all the distances between classes, so phenotypes or regions, and can export this into, into your output files and then generate, distance measurements.
And further on, you can also display, all your phenotypes in phenographs. So this is a dimensionality reduction where you can look at the display and the clustering, and you can look at the fingerprint of your tissue samples and compare them to each other to see differences in, the, combination of the phenotypes within the tissue.
The first thing you do for the image analysis is to limit your analysis to a region of interest.
In green, we have detected automatically the tissue and have, annotated in blue here on the IF image the region of interest for the tumor region.
An expert pathologist can also do this as offered by Altiview directly on the h and e stained, tissue image that is, available together with the MIF on the same section.
After annotating the region of interest, we use the cytokeratin channel to generate with a deep learning classifier a c k segmentation within the region of interest to separate the tumor epithelial region from the strong.
The invasive margin around the tumor epithelial segmentation is shown here in with two margin zones of each fifty micrometer diameter, one in cyan and one in red, which, will later be also used in the data analysis where you can then show the distribution and the densities of the phenotypes within these different areas.
If we look in more detail at the, tissue segmentation and the invasive margins, you see in blue the CK segmentate.
And also within these, margins that are far from the tumor, mass, you see some single cells that are CK expressing.
This could be either invasive cancer cells or this could be reactive stromal cells.
But the more you find of these and you can quantify this then with our software, the more you can look into the invasiveness of such a cancer case and give a predictive. And this has a predictive value for the survival of the patients.
The immuno eight plaques as already shown by, my LTV colleague is super high plex and very information dense. So if you look at all eight markers at once, we are not cognitive, capable to to to sub identify and deliver this, image.
So when you look at this region, and we only look at the lineage markers, then we already see that a lot of these, CD4 expressing cells and, are surrounding together with the macrophages the the tumor islands here.
So they are, like, delineating it.
And you see within the tumor epithelium, you see CD8 positive cells.
And what I want to focus today is the cytotoxic t cells and when they are becoming either exhausted or primed with the expression of PD-1, which is available in this kit, and, macrophages and tumor cells that are expressing PD-L1.
So the first thing we are doing when, when we want to do the phenotyping asset is that we have to segment the cells.
Here you see the result and the the layer mask of the cell segmentation for, the host light and for this region.
Then we do the phenotyping on top of that. And here, I’m only showing you some, lineage markers. So you see, here are our macrophages.
Here are the tumor cells in purple. We have the c d eight in green, and we have, c d three in cyan and c d fours in pink.
And you we can already see that macrophages seem to shield the tumor from the invading, t cell compartment.
If we add on top our, functional markers to the lineage markers, we see that the FoxP3 positive cells are intermingled with the, macrophages, and the PD-L1 positivity is mainly on the macrophage population in this case, really shielding and delineating exactly at the line of the tumor epithelium, the tumor from the, from the t cells. And PD-1 expressing cells are either in contact in in in the invasive margin with these PD-L1 expressing, macrophages, as you see, or are, on the tumor.
We can also visualize this a bit, more easy by only showing, with our software dots on top of these cells that you can then give, specific colors to see the grouping of your, of your cells. Here is set.
I would like to focus on the capabilities for, distribution of these biomarkers. So you see the heat map for cytokeratin on the left. In the middle, you see the heat map for, CD68, for macrophages, and CD3, CD8 double positive cells.
The heat maps are all normalized so that the yellow color is around three hundred, cells per square millimeter density.
If we then add the functional marker PD-L1 and PD-1 on top, then you see that CK positive, PD-L1 x double expressing cells are mainly in the region down here and some scattered cells in the tumor, while CD68 PD-L1 double positives have a hot spot also correlating with the, CK expression and are around the tumor islands that are, towards the larger, stromal areas.
And the CD3, CD8, PD-1 triple positive cells, these are mainly around the whole tumor tissue and are also on the tumor epithelium.
We can also combine the two heat maps for visualization and, by multiplying PD-L1 here with a CD8 PD-1 double positives.
And this leads to this phenotype clustering where you see that the, the spatial correlation is the has the highest possibility around this area and around these two areas where you have the CK and, PD-L1 expression and the PD-L1, high macrophageal units.
When we are exploring the tumor epithelium versus the stronger densities of our phenotypes, we can clearly see that in the stroma, we have higher expressions of the t cells compared to the tumor epithelial area.
And we also have more macrophages, macrophages, in both populations, CD68 only or double positives with PD-L1, so the more m two like phenotypes in the stroma.
For the CD8s, this is, the opposite. So we have more CD3, CD8s that are unprimed within the stroma. And on the tumor epithelium, most of the CD8 become, positive.
We can also look at more rare phenotypes that are identified. For example, CD8 cells that express FoxP3 and CD8 FoxP3s that are also PD-1 positive or CD4s and CD8 double positive cells and CD4, CD8, FoxP3 triple positive cells, etcetera.
But if you think back into the, marginal zone, segmentation we did, we can also investigate where are these cells at the highest density of this. Is this on the tumor as for CD8 with PD-1 expression?
And there we see that we have a clear, draw between the inners inner, in invasive margin and the and the tumor epithelium.
While the c d three, c d eight are, also more distributed across these three, three, areas.
This is also similar for the CD68s that are PD-L1 positive, so they are similar in density, between the two margins.
For CD8 and, PD-L1, a direct interaction is important.
Therefore, we can also do spatial analysis of our phenotypes by looking at the cell cell contact.
For this, we use our cell segmentation mask and then bring out the phenotypes, so only the CD8 expressing cells.
And then we look at all cells that are in direct contact with these, CD8.
And then we can take these as another class out and sub phenotype this then further, and look which are the cells that have the highest, frequency in contact with our CD8s.
And this we can do for all phenotypes, and we can do these experiments, over and over for all, of the resulting phenotypes and then compare across cases.
Visiopharm’s platform offers, multiple possibilities to explore the represented classes in the whole slide tissue or your biopsies or tissue microarrays. So you can look at phenotype profiles, where you see the percent of, positivity and that is identified of these, different phenotypes as a bird’s eye view bar graph heat map, for example.
We have the possibility to also use t SNE dimensionality reduction to, to investigate the clustering of different phenotypes and also to look at the fingerprints of your samples.
You can then also look at the phenotype matrices, which phenotypes are, expressed within your cases.
And you can also, look at the neighborhood plots that is available within our software to understand if your cytotoxic t cells are clustering, for example, with proliferating cells in general.
With this, I hope I could show you that the Visiopharm multiplexing analysis capabilities are powerful and that with the IO eight plex by Altiview, we can explore a lot of phenotypes and also identify them and look at the interactions of all of these cells. So I only showed you one aspect of looking at PD-1, PD-L1 axis on, cytotoxic t cells and macrophages and tumor cells.
But you, you can look at all different combinations like FoxP3 CD4 distances to CD8 or the clustering of PD-L1 CD4 double positive, regulatory cells or, t helper cells to CD8 PD-1 expressing cells.
And what is this relation to the general PD-L1 expression?
You can look at all different distances on which you are interested in, and get them as an output.
And you can compare all of this to other cases. So you can apply the same algorithms to the same, assays on on the same indication or tweak for the next indication and, move your analysis forward.
So Visiopharm offers this flexible toolbox to build your own, apps, so algorithms, and workflow to answer your specific scientific questions.
You can use deep learning classifiers and train them by example, by defining regions for the analysis or measurements.
All the app workflows are fully customizable, and all outputs are accessible.
And you get the numbers you need or export the entire dataset, so you are not limited to that.
And our platform is fully integrated with the multiplex phenotyping workflow for automated phenotyping.
With this, I would like to thank you for your attention and thank Ultivue for giving us the opportunity to present our phenotyping capabilities for highplex in in fluorescence, assays.
I would like to thank our product team for the phenotyping, in computer vision and AI at the Visiopharm and David Mason for for providing me the skeleton for this slide deck.
Looking forward to the q and a session together with Angela, and looking forward to your questions. Thank you.
Thank you, doctor Vassaturro and doctor Schneider, for your informative presentation.
We will now start the live q and a portion of the webinar. If you have a question you would like to ask, please do so now. Just click on the ask a question box located on the far left of your screen. We’ll answer as many of your questions as we have time for.
Let’s get started. Okay. Our first question is, have you tried also other stains besides h and e after the Ultivue procedure such as the good quality PCR?
I guess that’s for me.
SR. I’m sorry.
Yes. So, we haven’t tried it, but I don’t think there would be, any issue because, basically, we have used H and E, since it is the most commonly used, staining in routine pathology, and basically proves the fact that we are not affecting the the tissue in any ways in terms of architecture and cellular morphology. So I guess what whatever other staining, like the one that was mentioned here, I guess is the precursor to the thread for collagen fibers should be something applicable, but we haven’t tried it.
Thank you, Dr Vasaturo. The next question is, how does the antigen retrieval work?
One more question for me. So, it’s basically the classical antigen retriever that you would perform also for, chromogenic IFC, like DAB staining.
So the protocol that we use is, fully optimized to run on the Bond RX. So, usually, this is, here two, which means, pH nine. But it’s really if you would do it manually for any of the classical, antigen retrievable books can be used.
Okay. Thanks again, Dr Vasaturo.
Let’s see. Let’s I think that, Dr Schneider is still trying to get his audio connected for the q and a. So let’s see. If I ask a question that’s for him, well, just let me know, and we can postpone that until he’s connected.
So our next question is, would this system be cost effective for large sample sets, I e seventy samples, or better suited for smaller amounts of slides?
I’m not sure if this is a question related to the staining portion or the analysis portion.
And I think it’s a question that might be if it’s staining related, it might be a better question to be addressed afterwards with the with the sales team. I can’t really comment on on some on costs.
Okay. Thank you. We really appreciate that. The next question is, is it the PhenoGraph module on market? Can you explain a bit more what it is? I was just wondering if this is the clustering algorithm or something else.
Yes. So now I’m back. So, my Internet connectivity here in my holiday site is very bad. I’m sorry for that. Yes. The PhenoGraph model is, on market, and this is, an automated clustering with, using a Gaussian mix model, and we are currently, working on updating that in the future.
Oh, great. We’re glad you’re back. Thank you, doctor Schneider.
Oh, good.
Our next our next question is, is it possible to visualize and and analyze of any particular biomarker combination on aggregate data from different groups of tissues, e g tumors from treated and untreated tumors?
Yes. If the essay is the same and the indication is the same, it is absolutely no problem to analyze, this from different cases.
So that you can train the model on, several images from from the same essay and then transfer it on, further samples and see how well it behaves on on these samples.
Alright. Thank you, doctor Snyder. And we have another question for you. Just wondering about the overlay of IHC and IF.
Oh, is sorry. My we have so many questions coming in. My my screen is skipping. Okay.
Is that mean we can overlay then make an app to analyze further?
Yes. So I think that you are referring to transfer learning with this question, and, yes, you can do this.
So you can, if this is stained on the same tissue section like with the Altiview, or if you have a serial true serial cut sections, then you can, coregister these and transfer the information from one slide to the next. And, our coregistration is very powerful and can, do this in most of the cases.
And then you can, learn one thing, for example, with IF to the HNE and transfer this and create your new algorithms to directly identify, cells in HNE, for example.
Alright. Thanks again, doctor Snyder. And there’s another question actually, two questions for you. Two questions in one.
Is this, or I’m sorry. Is the deep learning process algorithm explainable from the regulatory point of view? And any help timeline for FDA or CE certification of the software as a medical device for clinical diagnostics?
Okay.
So I don’t think that any of the deep learning process algorithm are yet explainable for regulatory point of view.
We would have to to look into this question and get back to you. But if you shoot me an email, I can definitely bring this to our regulatory, chief of our regulatory department and discuss this with Ithar Abels.
And for this FDA or CE certification, we have, IVD, CE marked, apps for IHC markers like k sixty seven, HER2, ERPR, tumor, nest detection in agent e in lymph nodes from breast cancer patients. So, yes, that is possible, but you need a lot of training material and a lot of sites and need to coordinate to get this, approved.
Alright. Thanks again, doctor Snyder. And you’ll have an opportunity to, you know, connect after this. We really appreciate, you doing that. Okay. Our next question is, how does the cell segmentation work based on nuclear nuclei expansion or also by other?
Yes. So the current cell segmentation works on the expansion of, the nuclei. So this is the first thing what we do.
We can also, incorporate training that you, learn from the lineage markers.
And the but this is something what you would have to do on your own currently. So the the algorithm doesn’t know this yet.
Alright. Thanks again, doctor Snyder. Let’s have another question.
Can you comment on antibody stripping and reprobing, and what makes UltaView so different?
Yes. So, antibody stripping is something that we don’t do at all. So, basically, we perform one single, incubation of primary antibodies. So everything happens simultaneously.
We do not need to do sequential staying, and therefore, we do not need the antibody stripping. And this is something that can really affect the antigenicity of your tissue, as well as the tissue morphology, which we try to avoid completely. So what is what makes Altium is so different is really, the fact that we do, one single step for each of the, step required for the staining. So retrieval is only one, antibody primary antibody incubation is only one.
And then we also add on top of that an amplification step, which is, increasing the the signal to noise and then allows a better a more consistent data and a better, algorithm development.
Thank you, doctor. We have another question coming in. Let’s see.
What are the specific tissue requirements? Is the technology amenable to needle biopsy or even small metastatic tumor samples?
Well, I think this question goes very much, with the previous one in the sense that, you know, when you are performing sequential staining and you need to repeat, a kind of retrieval or use a stripping step, and you are working with very small samples or, like, needle biopsies, then you are afraid that your basically, your tissue can fall off the slide. But in in this specific case with the optical technology, we do not have this risk.
So there is no special requirement other than the classical ones that you would have also for any other, IHC staining. So you wanna have, slides that have been cut recently. You don’t want to, have epidural degradation before you perform the staining, so you need to pay attention, to your slides. But also, you know, most of it is done at the very, initial phases when you collect the samples and the way you embed them, the way you preserve them, which is something typically done, and, taken care of for any type of staining zone.
The short answer is that no specific requirements are there, and we can work with very small tissues as well.
Thank you, Dr Vasuturo.
Our next question is, cells in solid tissue are usually close together or close to each other forming clumps and or overlapping with each other. How does the Visiopharm software deal with that?
Yeah. That’s a great question. So that’s something that, the user would then need to, train also the deep learning classifier.
And the more the more general you cut your sections at the same section sickness, the better your, your model will behave on your, on your samples.
But we we cannot guarantee that all the cells that are overlapping with each other are, are identified correctly.
And for this, even if especially when they have the same lineage markers, then it’s becoming tricky for the algorithm.
But for this, we would like to to introduce also in the future that that the users can, can correct for these mistakes.
Thanks.
Thank you, doctor Snyder. Our next question is, what qualifies an Ultivue technology antibody versus a standard IHC antibody?
Great question. So the antibodies that we use are usually the, clinical relevant clones when they are available. So, basically, there is no difference between an an antibody that you would use for the classical DAB staining, or an antibody that you wanna use in the, with the ISP technology.
So, and, the the proof for that is is also that, DAB staining is, is still our gold standard. So whenever we work with an antibody that is developed to work on paraffin embedded samples, then this can be used can be developed for ISP. And we will always start from DAB testing the sensitivity and specificity of the antibody, and then we will conjugate it with our DNA barcode, and, repeat the staining in DAB to make sure that this has not affected the performance of the antibody, and then eventually move it into fluorescence. So we can work with any, antibody that has been developed for, graphine samples.
Thank you, Dr Vasaturo.
And another question. Let’s see. What other software can you use for image analysis of the MIS?
Maybe that’s a good question. Yeah. I think I will take this question because, well, Visiopharm, of course, and then we have seen it in action. But, in principle, we are not limited to any specific software.
So we work also with other partners for image analysis, and, the choice really depends on the depth of, the phenotyping you wanna do and the complexity of the analysis you want to perform.
So you might even think if you just wanna look at the density of a single lineage marker, you can even use the the freely downloadable software that are online. But, of course, if you, if you wanna do a much deeper analysis and you wanna understand more and you wanna go into, spatial distribution, proximity analysis, etcetera, then you need to use, a software like the BC Pharm.
Thank you, doctor doc Passaturo. I’m sorry. I’m trying to read questions and talk at the same time. So the next question is, do you have any recommendations regarding suction thickness to get gold good multiplex staining as well as cell detections?
Well, I can talk through the, thickness for staining. We usually work with the the classical three to five microns slide.
It really depends a little bit also on the customer request. So in house, I think, usually, we use four micron slide thickness, but there are some customers that also request three and some others that request five. I don’t think it changes a lot in terms of the cell detection because you are still below, the, size of of the cell. So you know that, basically, if you look at c detections, if you have four or five margins, you are not looking at the exact same cells. So maybe, Fabian, if you wanna comment further on the thickness and the how this would impact the analysis.
Yeah. Thanks.
So we have we have tested that. And also in my previous jobs, we have tested the the section signals, and we found that the the best consistency we found was three or four micron.
So that was really the best where you don’t have too many cells that are overlapping or or hiding each other or on top of each other. And the more you will turn into five and six micron, the more you also have, section sickness, artifacts because, you can’t guarantee always that you cut at the same, size due to temperature changes, etcetera.
Alright. Thank you both. And let’s see. We’ve got another question.
Typically, many image analysis tools are greatly influenced by inconsistent staining results.
How does Visiopharm software account for inter and intra run variability in staining quality?
Yeah. This is a great question, and we get this asked a lot. So I think our software cannot do anything about inter inter run variability if the variance is really high.
So we in image analysis, you rely on the input data that you get. And if these are inconsistent, then even the best models cannot, take, this into account.
So you have some tools at hand that you can use. So for example, you can use one of our normalization tools that we, recently deployed where you can also do the normalization across images in your batch.
And we are still, working on how to do the a good image, normalization thresholding and have this adaptively transferred onto other images.
Well, it looks like thank you so much. It looks like that’s all we have time for, for today.
Do either of you have any final comments for our audience?
Well, I think we have been able to convey the message that it’s really important to define up from the best biomarkers to combine and not just think about the number of markers you can have on the same slide, but really think through the hypothesis that you want to validate and then have a very robust and reproducible assay that eventually allows you also to have a very robust, very robust data on the image analysis side and facilitates also the the task of, building an algorithm that can be applied across multiple indications and across multiple, trials.
Yes. I can just echo that. And with one of the things that one of my former boss at AstraZeneca, Carl Barrett, was always saying, first think about your hypothesis before you put the panels together.
And I think this is a very wise one. And, first, we need to all think about what is the mechanism of action or the proof of mechanism that you would like to see because most of the phenotypes that you are are hunting are already known.
And, if you would like to combine an image analysis with your RNA sequencing data from single cells, then you have already maybe new targets that you would like then Ultivue to test new antibodies on or to develop new panels. And then you can either have custom made, algorithms from Visiopharm as a service, or you can develop with our modules your, algorithms on your own and then use them for further validating your your new hypothesis and your mechanisms of action.
And maybe just to really close-up on this, I think, also, you had a quite strong scientific team that can help you discussing, the ideal combination of markers and utility you need.
Well, thank you again, doctor Vasaturo and doctor Schneider, for your time today and for your important research. We would also like to thank LabRoots and our sponsor, Ultiview, for underwriting today’s educational webcast.
Before we go, I’d like to thank the audience for joining us today and for their interesting questions.
Questions we did not have time for today and those submitted during the on demand period will be addressed by the speaker via the contact information you provided at the time of registration.
This webcast can be viewed on demand. LabRoots will alert you via email when it’s available for replay.
We encourage you to share that email with your colleagues who may have missed today’s live event. Until next time.
Goodbye.
Immunotherapy has transformed the treatment of metastatic and recurrent solid tumors but is challenging in that only a minority of patients respond. Therapies that rely on immune activation, such as checkpoint inhibitors, have been shown to be especially difficult due to the complex and heterogeneous immune escape mechanisms which can develop in each patient. Therefore, development of robust biomarkers coupled with spatial analysis of tissue is key for enabling rational patient selection and the design of precise combination therapies.
The use of multiplex immunohistochemistry/immunofluorescence (mIHC/IF) provides much needed insight into cellular composition, cellular functions, and cell-cell interactions. Importantly, recent studies have used mIHC/IF to explore specific immune cells as part of the tumor immune microenvironment (TME) and found that it is helpful for clinical prognosis and efficacy prediction in patients with cancer.
In this presentation we will show a streamlined unique workflow supporting whole slide imaging of an 8-plex mIF and H&E fusion on a single tissue slide for a comprehensive tissue immunophenotyping analysis.
-
- The utility of a high throughput, high-plex (Immuno-8) staining and mIF assay development for scientists and clinicians
-
- Demonstrate how advanced AI-driven image analysis can be applied to discover cell types, populations and morphological context
-
- Discuss how whole slide image analysis of the tumor microenvironment can provide insight into specific cancer types
Fabian Schneider, PhD, Service Project Lead, Visiopharm
Dr. Fabian Schneider is part of Visiopharm’s R&D and Product Management team, responsible for phenotyping products as well as service projects for custom APP development. Fabian has over 10 years of international experience in cancer biology and immuno-oncology, working in academic research labs, clinical research teams and computational pathology groups in both academia and biopharma. Fabian received his Dr phil. nat. in Cell Biology in 2011 from the Johan Wolfgang Goethe University Frankfurt, Germany.

Angela Vasaturo, PhD
Associate Director, Biomarker Strategy and Applications