In the final episode of the three-part series on phenotyping, Dr Aleksandra Zuraw and our Scientific Consulting Sales Manager, Regan Baird, discuss important factors to consider when selecting image analysis software for phenotyping.
Further reading:
The two key considerations when selecting a phenotyping image analysis software are segmentation assistance and data visualization.
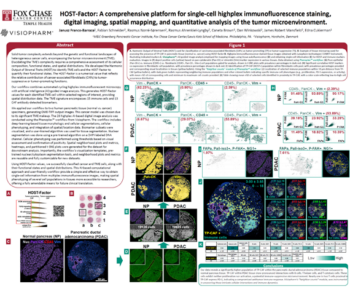
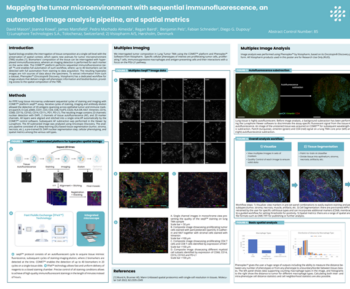
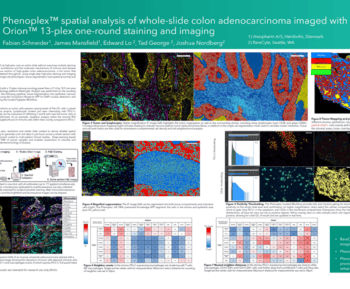
Segmentation assistance: To determine cell phenotypes, the boundaries of cells in tissue slides must first be defined. This is known as cell segmentation and can be automatically performed by image analysis software. Cells in tissue slides can vary in shape and size, making segmentation difficult. Image analysis software can use either rule-based classical computer vision or AI-powered approaches to estimate cell boundaries. Visiopharm offers an AI-based nuclear segmentation followed by a rule-based and marker-based step to achieve the most accurate cell segmentation for phenotyping.
Data visualization: The proper visualization and management of obtained data is crucial and depends on the software used. To interpret multidimensional multiplex and phenotyping data, visualizations such as graphs, plots, and two-dimensional reduction plots must be used for all images in multiplex studies. The right visualization tools are needed to evaluate phenotyping performance and export meaningful results.
- Let us know what you think of the episode and any topics you would like us to cover in the future by sending us an email at: podcasts@visiopharm.com


