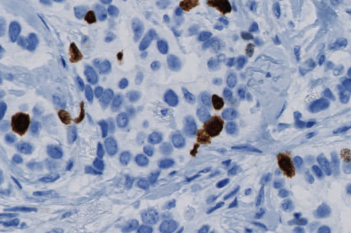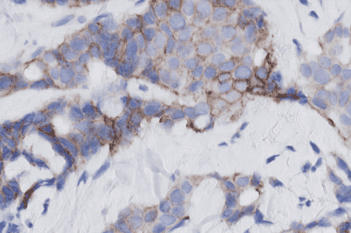
Macroscopic view of Ki-67 stained slide
#20114
Standardizing hot spot analysis
Cancer can rapidly mutate and adapt, potentially producing heterogeneous tumors making it important to evaluate a specimen in a hot spot, where the tumor cells have increased activity.
Hot spot analysis for Ki-67 scoring has often been used for proliferation index assessment in breast cancer [1]. However, manual hot spot scoring – like manual global scoring – is subjective and prone to both intra- and inter-observer variability and has shown a lesser reproducibility than global scoring [2].
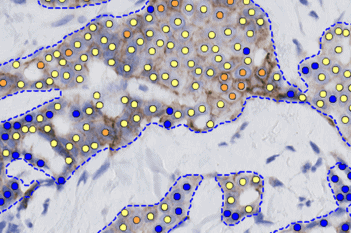
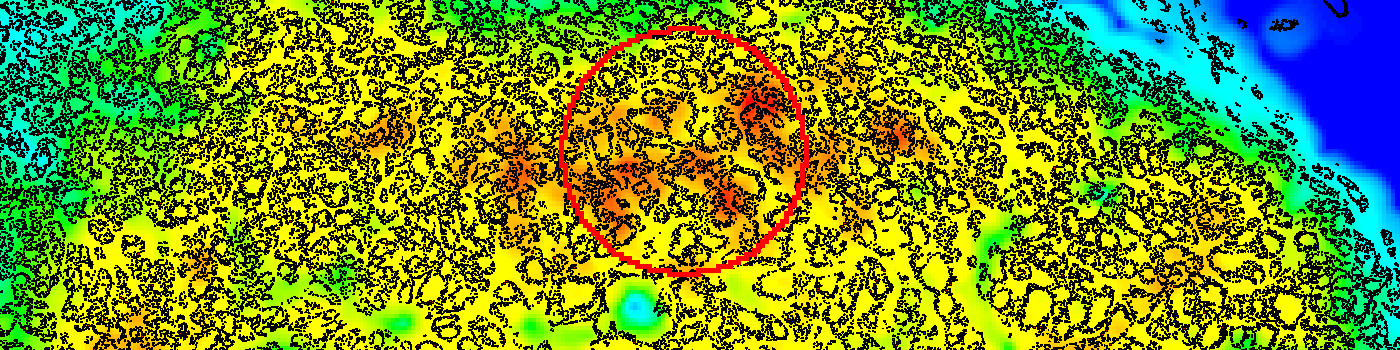
The Hot Spot APP provides an automatic and objective hot spot scoring that has been shown to outperform manual biomarker assessment [3]. The APP presents pathologists with a heatmap for easy visualization of tumor heterogeneity.
Our Hot Spot APP is configurable for both shape and size to facilitate analysis of different types of tissue and stain.
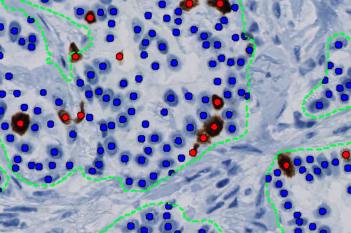
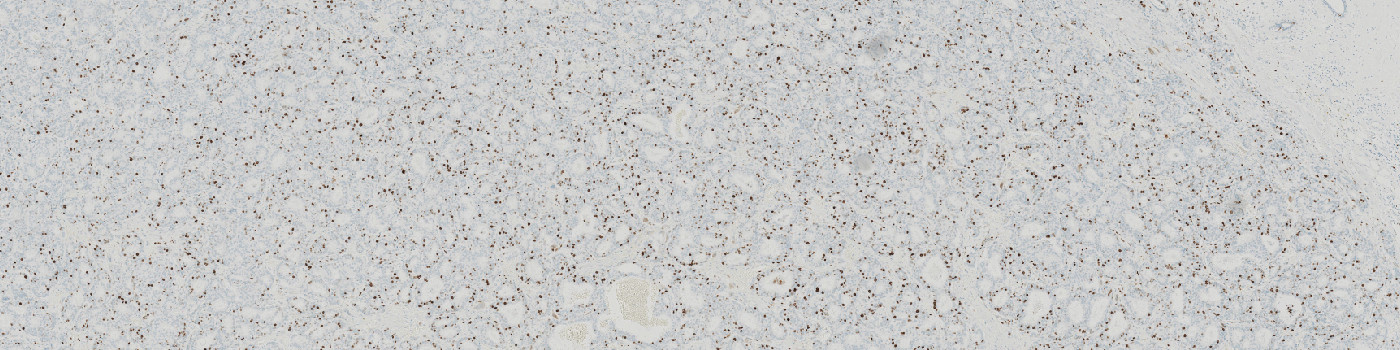
The APP works in combination with and after a nuclei (or cell) classification APP like Ki-67 or others and creates a heatmap with identification of the hot spot and quantification of e.g. the proliferation index within the hot spot.
Benefits of Hot Spot APP
In EU/UK: CE IVD – for use in diagnostic procedures
Macroscopic view of Ki-67 stained slide
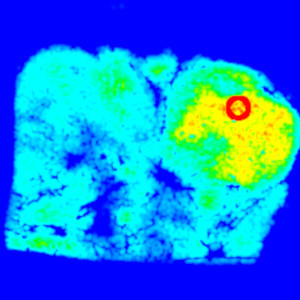
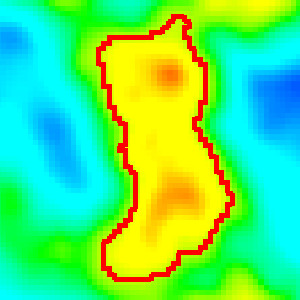
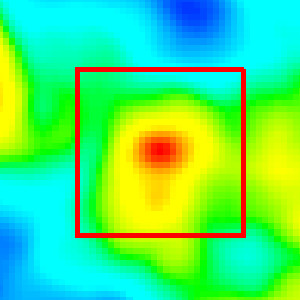
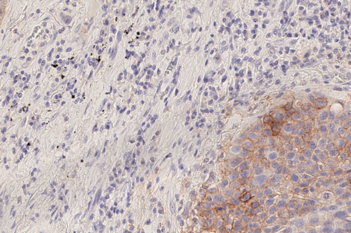
Macroscopic view of the created heatmap and the hot spot (red circle).
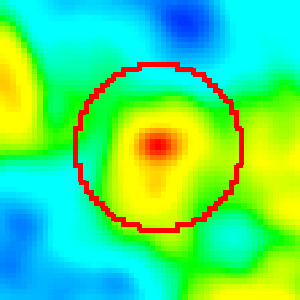
The hot spot shape is defined in one of four ways, here as a circle of a fixed size.
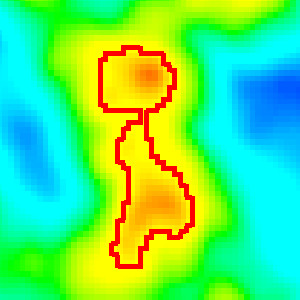
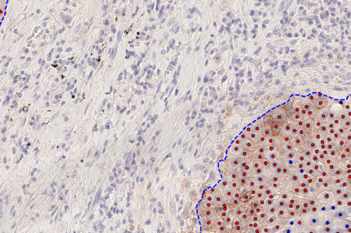
The hot spot shape is defined in one of four ways, here as a shape that follows the heatmap contours until a predefined number of nuclei are contained within the hot spot.
Quantitative Output variables
The output variables obtained from this APP include:
References
1. Assessment of Ki67 in Breast Cancer: Updated Recommendations From the International Ki67 in Breast Cancer Working Group, JNCI: Journal of the National Cancer Institute, Volume 113, Issue 7, July 2021, Pages 808–819
2. Jang, M. H., Kim, H. J., Chung, Y. R., Lee, Y., & Park, S. Y. (2017). A comparison of Ki-67 counting methods in luminal breast cancer: The average method vs. the hot spot method. PloS one, 12(2), e0172031.
3. Stålhammar, G., Martinez, N. F., Lippert, M., Tobin, N. P., Mølholm, I., Kis, L., … & Grunkin, M. (2016). Digital image analysis outperforms manual biomarker assessment in breast cancer. Modern Pathology, 29(4), 318