
The Precision Gap in therapy-linked biomarker testing
A structured analysis of diagnostic error and its clinical consequences
Executive overview
The oncology drug development landscape is undergoing a structural transformation. Targeted therapies, including antibody-drug conjugates (ADCs), bispecific antibodies, and other precision modalities, increasingly depend on subtle quantitative differences in biomarker expression. Weak expression levels, heterogeneous tumor distributions, and sub-cellular localization patterns now directly determine therapy eligibility.
This shift raises the bar for diagnostic reliability for precision medicine. Therapy-linked biomarker testing must deliver reproducible, quantitative, and often sub-cellular precision from tissue-based assays such as IHC and ISH. However, current pathology workflows were largely designed for binary or near-binary classification tasks.
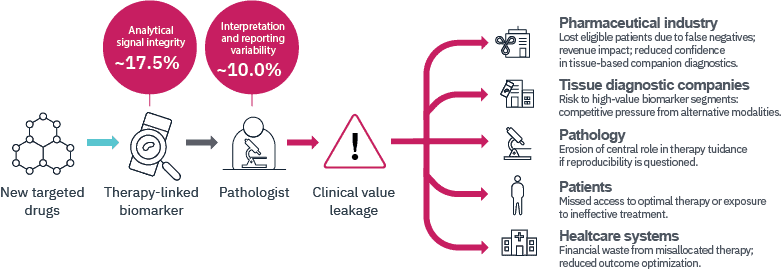
This analysis introduces a structured, clinically oriented framework to analyze where diagnostic error arises in therapy-linked biomarker testing, estimates the relative contribution of different error domains, and examines the broader consequences for the oncology ecosystem. The analysis reveals a widening gap between therapeutic demands and diagnostic performance, which we call the Precision Gap. It is primarily driven by two domains: Analytical Signal Integrity and Interpretation Variability.

1. Rising therapeutic complexity and the demand for diagnostic precision
The practical implication of this therapeutic shift is a new set of diagnostic requirements for therapy-linked biomarker testing.
Modern therapy-linked biomarkers often require:
- Discrimination near clinical cutoffs
- Quantitative reproducibility across laboratories
- Stability in weak-expression regimes
- Reliable assessment of sub-cellular localization
Small deviations in staining intensity or scoring interpretation can directly alter therapy eligibility. As a result, diagnostic reliability becomes a central determinant of therapeutic value realization.
To understand where and why variability arises, we must examine the full pathway from biopsy to final biomarker report in a structured and clinically meaningful way.
2. A unified five-domain framework for diagnostic variability
Rather than listing individual technical steps independently, we group clinically relevant sources of variability into five domains. These domains reflect how deviations ultimately manifest in diagnostic classification rather than how they originate operationally.
The five domains are:
- Biological and Sampling Limitations
- Ischemia and Fixation-Related Signal Degradation
- Processing and Sectioning Artifacts
- Analytical Signal Integrity
- Interpretation and Reporting Variability
Together, these domains encompass the pathway from tissue acquisition to final clinical report without double-counting overlapping root causes.
Domain definitions
| Domain | Definition | Primary clinical mechanism of error |
| Biological and sampling limitations | Variability arising from tumor heterogeneity or non-representative sampling of the lesion under evaluation | The analyzed tissue or selected region does not accurately reflect the clinically relevant biomarker status, leading to potential misclassification, particularly near therapeutic cutoffs |
| Ischemia and fixation-related signal degradation | Variability introduced during the interval between tissue excision and stabilization, including fixation timing and quality | Degradation, masking, or altered accessibility of epitopes reduces detectable signal intensity and may cause systematic underestimation of biomarker expression |
| Processing and sectioning artifacts | Mechanical or physical distortions introduced during tissue processing, embedding, sectioning, and slide preparation | Uneven distribution or distortion of tissue architecture results in localized signal variability that may complicate interpretation |
| Analytical signal integrity | The ability of the assay system to generate and maintain accurate, reproducible biomarker signal over time | Reduced analytical sensitivity or specificity due to reagent variability, assay drift, insufficient calibration, or inadequate quality control leads to systematic bias, often toward false-negative results |
| Interpretation and reporting variability | Variability in translating biomarker signal into a clinical decision, including reader-dependent scoring and threshold application | Inconsistent application of scoring criteria or instability near clinical cutoffs results in therapy eligibility misclassification |
The following analysis will refer to these five categories.
3. Estimating relative contributions of error domains
To estimate the relative impact of each domain, we apply a heuristic model that follows classical risk analysis:
p (frequency): How often a materially relevant deviation occurs
s (severity): Probability that such deviation results in clinically meaningful misclassification
The approximate contribution of each domain is estimated as:
Contribution ≈ p × s
The purpose of this model is not to produce exact epidemiologic figures, but to directionally estimate relative magnitude across domains.
Domain definitions
| Error domain | Est. freq. (p) | Est. sev. (s) | Basis for estimate | Approximate contribution (p × s) |
| Biological and sampling limitations | 0.10 | 0.40 | Frequency (p): Biopsy–resection studies across key therapy-linked biomarkers show low-double-digit discordance. Because discordance reflects a combination of sampling, analytical, and interpretive effects, we conservatively attribute approximately half to biologically non-representative sampling. | ~4.0% |
| Severity (s): Not all sampling-related expression differences cross clinically actionable thresholds. Based on reported cutoff-sensitive discordance patterns, we estimate that ~40% of biologically non-representative sampling events result in clinically meaningful misclassification. | ||||
| Ischemia and fixation-related signal degradation | 0.06 | 0.60 | Frequency (p): Guideline-based audits consistently report low-double-digit rates of cold ischemia and fixation deviations. Because only a subset of these deviations materially attenuate biomarker signal sufficiently to affect clinical classification, we conservatively estimate a 6% frequency of clinically relevant fixation-related degradation. | ~3.6% |
| Severity (s). When fixation-related degradation is clinically relevant, antigen attenuation frequently shifts cases toward false-low classification, particularly near therapeutic cutoffs; we estimate ~60% result in clinically meaningful misclassification. | ||||
| Processing and sectioning artifacts | 0.03 | 0.30 | Frequency (p): While minor sectioning artifacts are common, clinically meaningful distortions affecting tumor-rich regions are uncommon; we conservatively estimate ~3% materially influence biomarker assessment. | ~0.9% |
| Severity (s): When processing artifacts affect evaluable tumor areas, they may distort local signal but often remain recognizable; we estimate ~30% result in threshold-crossing misclassification. | ||||
| Analytical signal integrity | 0.25 | 0.70 | Frequency (p): External quality assessment programs consistently report 20–30% insufficient staining performance across predictive biomarkers; we adopt a conservative midpoint estimate of 25% for materially relevant analytical signal deviation. | ~17.5% |
| Severity (s): Analytical underperformance typically produces systematic false-low bias; we estimate ~70% of materially insufficient staining events result in clinically meaningful misclassification. | ||||
| Interpretation and reporting variability | 0.20 | 0.50 | Frequency (p): Reproducibility studies show moderate agreement for PD-L1, HER2-low, and Ki-67, with discordance concentrated near clinical cutoffs; ~20% estimated to be materially interpretation-sensitive. | ~10.0% |
| Severity (s): Because reader variability clusters around diagnostic cutoffs rather than random noise, we conservatively estimate that ~50% of interpretation-sensitive cases alter clinical classification. |
Under these assumptions, overall misclassification approximates 32 percent.
While absolute values may vary, a consistent pattern emerges: Most of the clinically relevant diagnostic error arises from Analytical Signal Integrity and Interpretation Variability, with Analytical Signal Integrity representing the larger contributor.
More than 80 percent of the modelled error budget is attributable to these two domains combined.
4. Clinical Value Leakage
Diagnostic variability in these dominant domains produces what we describe as Clinical Value Leakage.
Clinical Value Leakage occurs when biologically eligible patients are not correctly identified for therapy, when treatment decisions are influenced by avoidable variability, or when confidence in tissue-based diagnostics is diminished.
Potential ecosystem consequences of Clinical Value Leakage
| Stakeholder | System-Level consequence of persistent diagnostic variability |
| Pharmaceutical industry | Reduced identification of biologically eligible patients due to false-negative or under-sensitive biomarker assessment; diminished real-world therapy utilization; potential reduction in confidence in tissue-based companion diagnostics as reliable development platforms. |
| Tissue diagnostic companies | Increased vulnerability of high-value predictive biomarker segments if reproducibility concerns persist; competitive exposure to alternative diagnostic modalities perceived as more standardized or quantitative. |
| Anatomical pathology | Gradual erosion of perceived reliability in therapy guidance if reproducibility and analytical consistency are not systematically strengthened; potential reduction in strategic influence within multidisciplinary oncology decision-making. |
| Patients | Risk of missed access to effective targeted therapies or exposure to suboptimal treatment due to misclassification near clinical thresholds; increasing clinical consequence as therapies become more precision dependent. |
| Healthcare systems | Inefficient allocation of high-cost oncology treatments; financial waste associated with misclassified therapy eligibility; reduced outcome optimization at population level. |
5. The Precision Gap: A structural adoption problem
Therapeutic precision in oncology is accelerating rapidly. Diagnostic precision is not advancing at the same rate. This divergence defines the Precision Gap: the widening distance between the biological precision demanded by modern targeted therapies and the reproducible precision delivered in routine pathology workflows. Importantly, this gap does not primarily reflect a lack of technological capability.
There is substantial evidence that AI-driven precision pathology can mitigate several of the dominant error domains identified in this analysis. Quantitative image analysis reduces interpretation variability, particularly near clinical cutoffs. Computational monitoring platforms support statistically rigorous control of stain quality and analytical signal stability. Digital workflows enable objective measurement, reproducibility, and continuous quality assessment.
The technical capability to strengthen both Analytical Signal Integrity and Interpretation consistency therefore already exists.
The Precision Gap instead reflects a lag in adoption. Despite demonstrated feasibility, digital and computational pathology continue to expand at a relatively slow, largely linear pace, as reflected in single-digit compound annual growth rates. This trajectory contrasts with the accelerating complexity of oncology drug pipelines.
As long as implementation remains limited, the dominant sources of Clinical Value Leakage will persist.
The reasons for slow adoption are multifactorial and extend beyond the scope of this analysis. The central conclusion, however, is clear: the Precision Gap is not a gap in technology, but a gap between available capability and implemented practice.
Digital pathology standardization considerations
Broader implementation of digital pathology introduces additional technical variables, including scanner performance differences, image rendering characteristics, color calibration, and display conditions. These factors require standardization, validation, and quality governance in their own right.
However, they represent a distinct class of technical variability that is measurable and controllable through engineering standards and regulatory validation protocols. They do not negate the central finding of this analysis: that the dominant sources of clinically meaningful misclassification in therapy-linked biomarker testing arise from Analytical Signal Integrity and Interpretation variability, both of which are addressable within digitally enabled workflows.
The second part of the blog is out now, follow up with how to close the Precision Gap.

Share this article

