Improving bladder cancer grading with AI-driven image analysis: A conversation with Prof. David Berman
As part of our Discovery Stories: People Behind Discovery series, we had the privilege of speaking with Professor David Berman, a leading researcher focused on developing high-impact cancer tests for prostate and bladder cancer patients. In this interview, Prof. Berman shares insights into his team’s efforts to improve bladder cancer grading. By using Visiopharm’s AI-driven software, they are automating the analysis of millions of nuclei, creating more accurate and objective grading systems, and tuning them to better predict patient outcomes. He also discusses how these advancements will advance the field of pathology and enhance clinical decision-making.

Dr. David M. Berman (Principal Investigator and Professor at Queen’s University in Kingston, Ontario) leads a research group developing high-impact cancer tests for prostate and bladder cancer. The team identifies novel biomarkers and therapeutic targets to improve patient outcomes by integrating data from genomic databases, experimental studies, and curated human biospecimens. This approach yields personalized management strategies tailored to each patient.
Read on or watch the video to learn how Visiopharm’s tools empower Prof. Berman and his team to push the boundaries of cancer research and diagnostics.
Visiopharm: What is the primary focus of your research?
Prof. David Berman: Our project focuses on turning bladder cancer grading into an objective algorithm. Pathologists today categorize early bladder cancer into low-grade and high-grade; however, there’s a great deal of variability among pathologists in how grading is performed. If a patient has low-grade cancer, they are typically managed with infrequent and limited surveillance. This surveillance involves inserting a camera through the urethra to examine the bladder for new tumors. While this procedure is necessary, it is uncomfortable, expensive, and inconvenient for patients. Additionally, it places a significant financial burden on health systems, making bladder cancer one of the most expensive cancers to manage.
In contrast, if a cancer is high-grade, the patient is offered more frequent surveillance and intensive immunotherapy, which is administered directly into the bladder. The difference between low-grade and high-grade is illustrated in the image below:
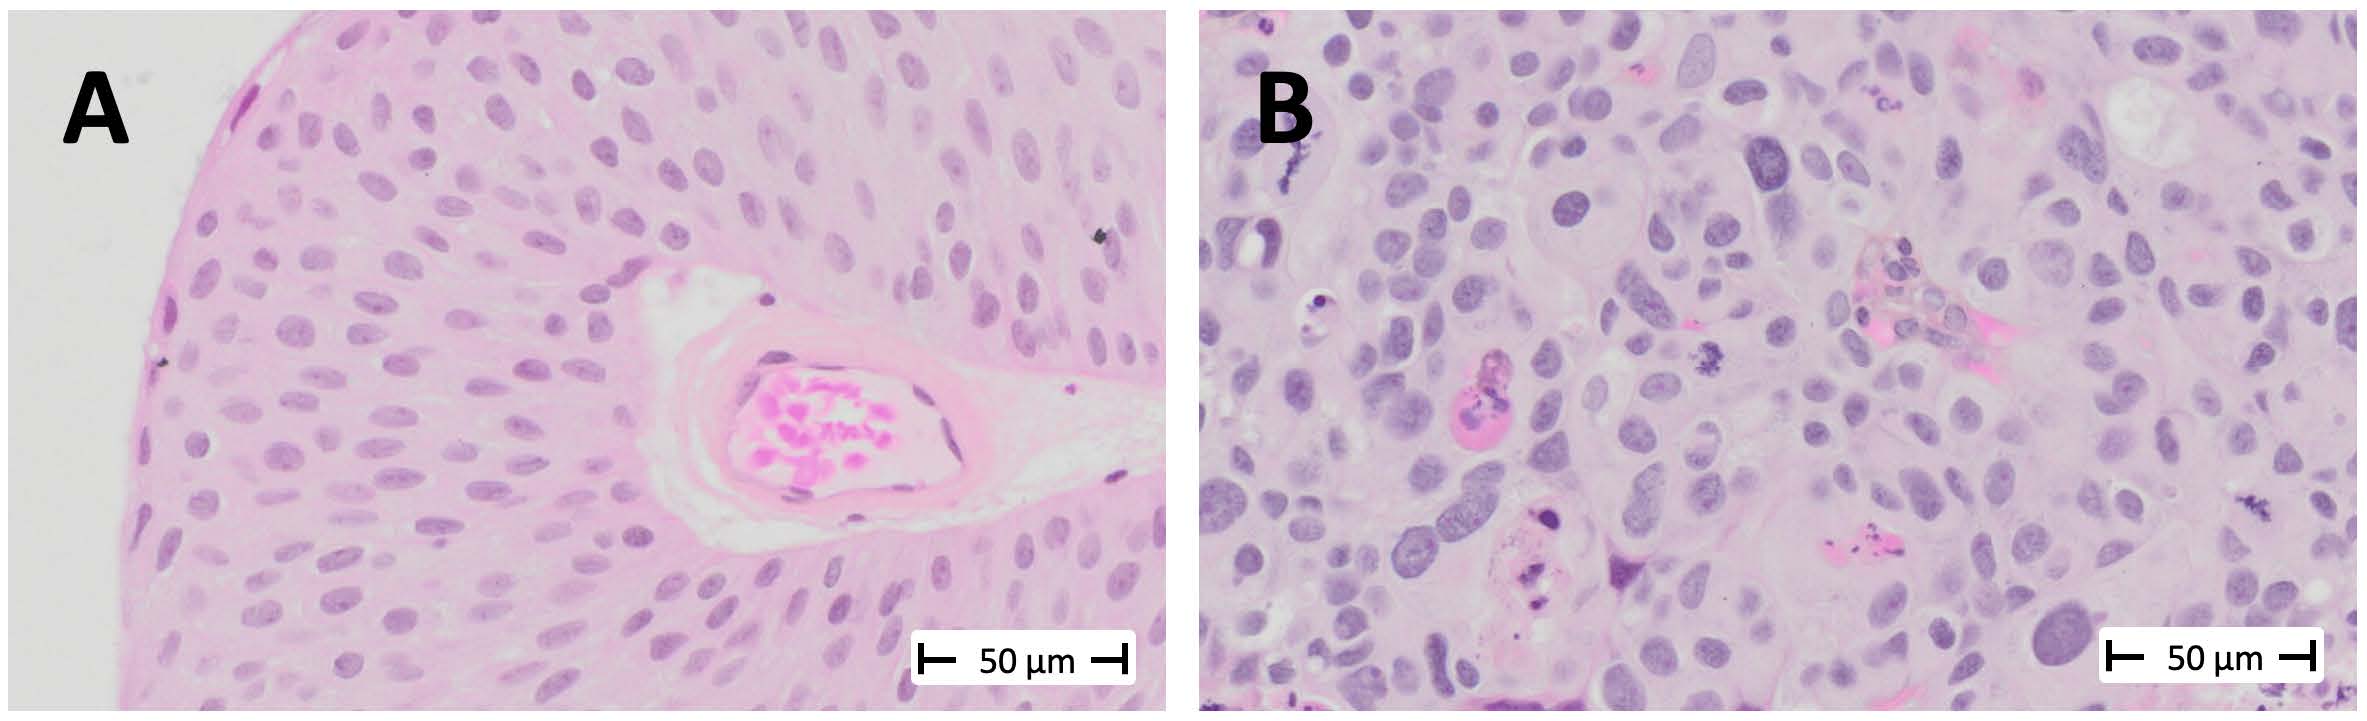
Low-grade tumors have relatively uniform-looking nuclei. Most of these nuclei are oval, and they are similar in size and shape. Most of them are also oriented in such a way that it appears as though you’ve combed the nuclei from the bottom of the screen toward the top. This creates a well-organized tissue. The cells respect each other’s space and align well with each other, much like they would in the benign tissue from which this cancer arises, known as the urothelium.
On the other hand, in high-grade cancer, the nuclei are not uniformly oval. They appear to be oriented in various directions, and you’ll notice that some are significantly larger than others. Some of the cells are undergoing mitosis, indicating rapid proliferation> These look like eyelashes or spider webs.
Like many studies before us, we found that even the best possible agreement among expert pathologists—like me, having specialized in urologic pathology for over 20 years—is about 80%. We had experts from three different academic centers review our cases, and we discovered that the same cancer could be treated differently depending on the pathologist about a third of the time. This unacceptably high level of variability is the best we can achieve because it largely comes down to judgment. There are many complex features involved in describing the size, shape, and orientation of cells in bladder cancer, which determine whether it’s low-grade or high-grade. But these features don’t involve precise measurements or numerical values.
For example, low-grade tumors may have occasional mitoses, while mitoses are more frequent in high-grade tumors. However, terms like “occasional” and “frequent” are subjective, and it’s unclear where to draw the line.
This is the issue we aimed to address in our study, which we published in collaboration with Regan Baird and Dan Winkowski from Visiopharm 1.
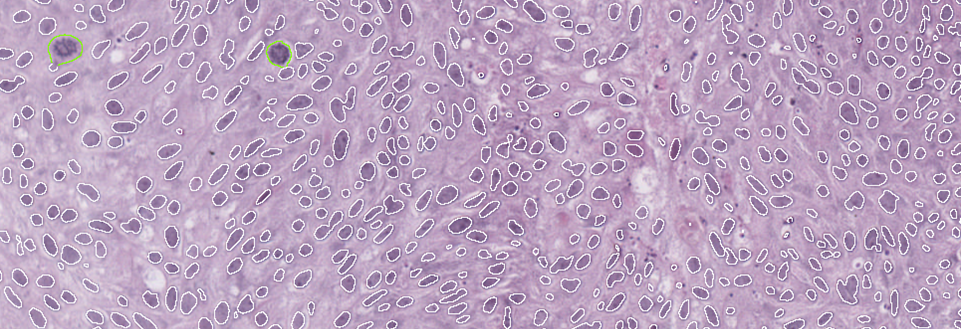
The study, led by Ava Slotman, who was then a graduate student in the lab, is the largest study of nuclear measurements as part of cancer grading. We measured over three million nuclei from 371 cases, including 641 images. Using Visiopharm, we measured every cancer nucleus in every case. This included an automated APP that we trained to distinguish cancer tissue from benign tissue. This process resulted in an enormous data set that we could analyze using complex algorithms to examine the differences between low-grade and high-grade tumors. Visiopharm provided us with a wide range of relevant features to explore in our analysis.
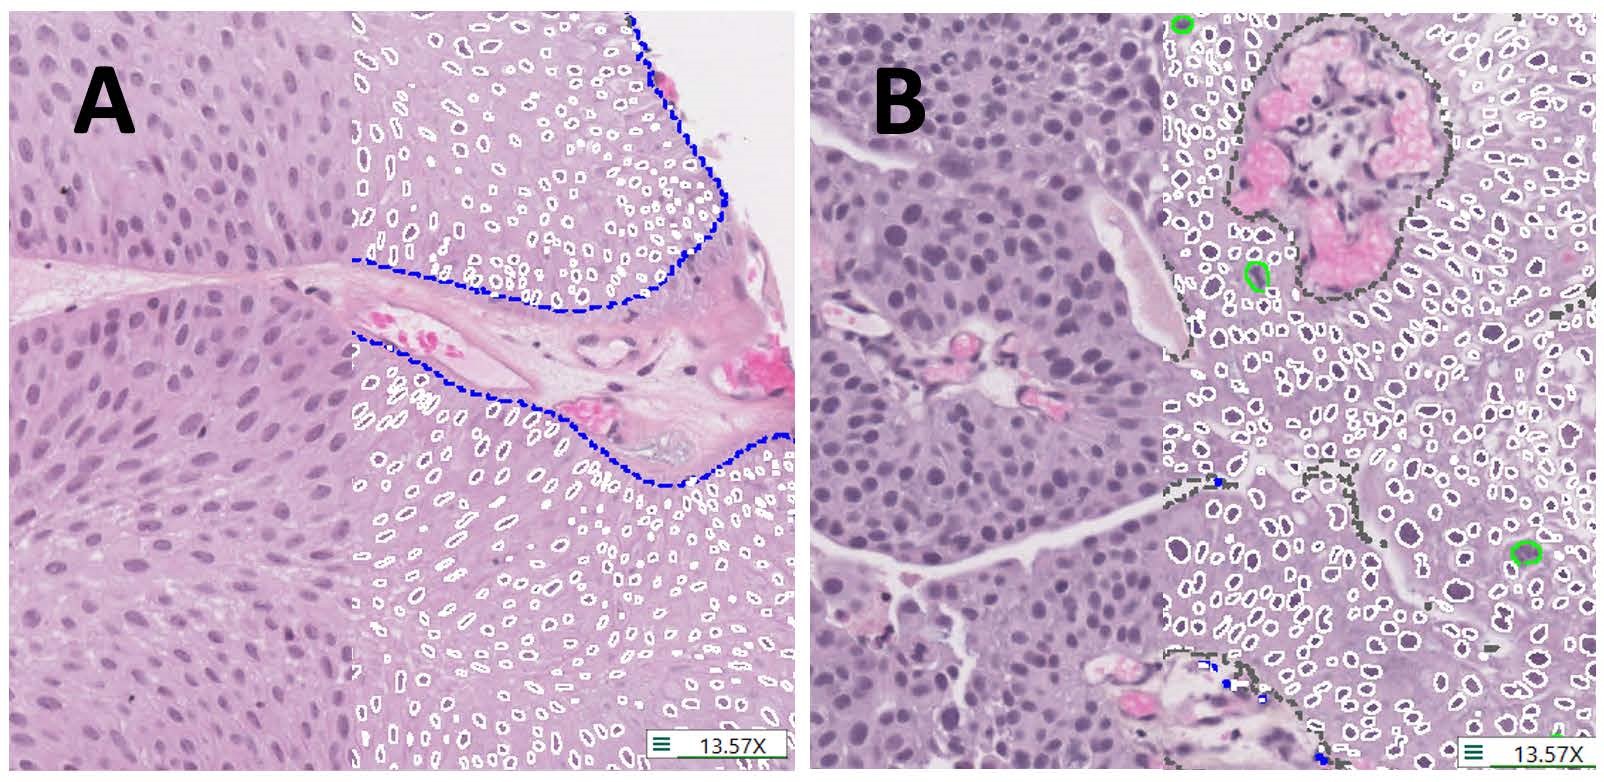
individual nuclei (white lines), mitotic figures (green lines) and tissue regions (blue dashes outline tumour,
grey dashes non-tumour). A. Histology representative of low-grade. B. Histology representative of high-grade.
We found that the most informative single variables distinguishing low-grade from high-grade tumors were variation in nuclear size, specifically the area, and the mitotic counts. Each of these factors was about 80% accurate in distinguishing between the two grades. From there, we developed more sophisticated algorithms that increased accuracy, such as random forest, decision trees, and logistic regression.
We believe that we have redefined and simplified grading by focusing on measurable features. In fact, we were able to externally validate one of these algorithms, the random forest, in another cohort. By using these features, we can actually improve grading so that it does a much better job of separating patients whose cancers recur quickly from those that recur slowly or not at all. This is part of our unpublished work with Katherine Lindale, which shows that we can create prognostic scores by reprioritizing the features.
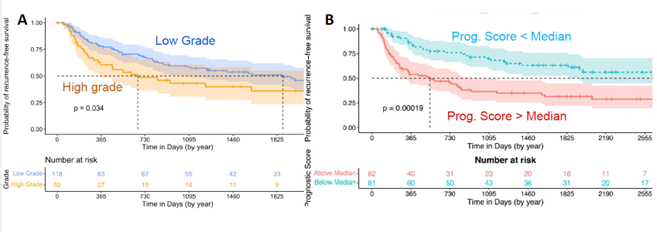
We use these curves to show the time to recurrence—essentially, how long it takes for a second cancer to develop after the initial tumor is removed. In Figure 3A, you see the results using regular pathologist grading for the entire case. There’s a slight difference between low-grade and high-grade tumors, but the clouds overlap, meaning the distinction isn’t very dramatic. While the difference is statistically significant, it’s not very pronounced.
In Figure 3B, you can see the results from our reprioritized grading algorithm using numerical cutoffs. This approach provides a much lower p-value and creates a greater separation between the curves. The bottom curve, representing low-grade tumors, recurs much faster than the top curve, which represents high-grade tumors that recur far more slowly.
This improved grading technique could significantly guide treatment decisions. Patients with low prognostic scores could be treated with less frequent surveillance and cystoscopy, and might not need immunotherapy. In contrast, higher-risk patients would receive the intensive surveillance and treatment they require.
That summarizes what we’ve done with Visiopharm and where we are now. Most of this work was done with small image samples, but we are now working together on an algorithm for whole-slide images, and progress is going well.
Visiopharm: What challenges or limitations in your research led you to consider using AI solutions like the Visiopharm software?
Prof. David Berman: Previous studies often relied on manual measurements of each nucleus, which would limit us to maybe a hundred nuclei per case instead of thousands. With manual methods, we might be able to measure a thousand nuclei, but very slowly, compared to the millions of nuclei we can measure using higher-throughput techniques. This increased throughput enables us to perform much more sophisticated analyses. Additionally, with the number of features involved, I don’t think we could have manually assessed and measured every single one of those features that I showed you in our study.
Visiopharm: In what ways did Visiopharm prove to be the only viable solution for your research needs compared to other tools or methods you’re considering?
Prof. David Berman: When we were choosing image analysis software, we found that Visiopharm offered a much richer dataset compared to other tools we were considering. It had many more features already built into it, and it was much easier to sequence different feature detectors one after the other in a pipeline.
Pricing also played a role in our decision. Some other commercial vendors would charge for each type of analyzer or software, while Visiopharm provided us with access to the entire package, which was a significant advantage.
Another key reason for choosing Visiopharm was their fantastic customer support. They truly felt like collaborators, and that level of partnership was incredibly important to us. It made the project go much more smoothly and continues to do so today.
Finally, we wanted to work with a group that could help us eventually bring this classifier to a clinical desktop. We knew Visiopharm had the connections and capability to make that happen.
“We didn’t want this work to remain solely in the research environment. We’re working toward getting it into clinical operation because we believe this approach can significantly improve patient management.“
Visiopharm: What are the next steps for moving from research to clinical application?
Prof. David Berman: The major step we’re working on now is moving from small image samples, which are about a millimeter in diameter, to whole-slide images. Pathologists diagnose bladder cancer—and other cancers—from whole slides, not from small image samples. Transitioning to whole slides will give us more power to analyze heterogeneity in these features and explore whether there is a specific proportion of the cancer that must be high-grade to drive a poor prognosis. This is something that other investigators have done qualitatively, but we see a huge opportunity to do it quantitatively using these tools. Additionally, validation with external cohorts is always necessary, and we are collaborating with several partners to make that happen.
Another important point is that much of AI use in pathology treats AI as a black box, where the image analysis program simply matches an image to a previous set of images and tries to emulate expert opinion. However, by focusing on “explainable” morphologic features that pathologists can see and verify themselves, we’re aiming for something more impactful. Our goal is not just to help pathologists who are struggling, but to elevate the work of all pathologists, even the best ones.
In regular practice, there’s no opportunity to match grading practices directly with actual patient outcomes. To do so, you would need to go back years later, review what happened to a patient, and then revisit the grading. This would require having proper measurements in place, and our research offers a new opportunity to achieve this kind of work in a much more accelerated way using AI and sophisticated computational technology.
Visiopharm: A lot of pathologists are still afraid of being replaced by AI, right?
Prof. David Berman: Yes, and I’ve heard even very sophisticated pathologists express that concern. But I wonder—do we really want to trust a program to make decisions on its own, without human expertise? For example, it could recommend very invasive and life-altering treatments like surgery to remove a major organ, chemotherapy, or immunotherapy, without any expert oversight. I don’t see that happening anytime soon.
“We don’t even have driverless planes yet, at least not with passengers. So, I don’t think AI will replace pathologists in that way anytime soon.“
Curious to see the work of Professor Berman? Check out these recent publications.
- Slotman A, Xu M, Lindale K, Hardy C, Winkowski D, Baird R, Chen L, Lal P, van der Kwast T, Jackson CL, Gooding RJ, Berman DM. Quantitative Nuclear Grading: An Objective, Artificial Intelligence-Facilitated Foundation for Grading Noninvasive Papillary Urothelial Carcinoma. Lab Invest. 2023 Jul;103(7):100155. doi: 10.1016/j.labinv.2023.100155. Epub 2023 Apr 13. PMID: 37059267.
Share this article

