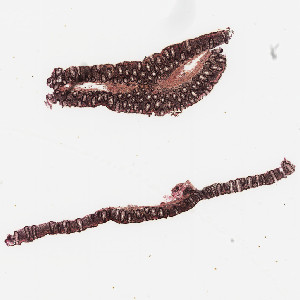
Raw image of colon tissue.
#10090
Microscopic colitis is a type of inflammation of the colon that causes chronic non-bloody watery diarrhea. The disorder cannot be detected using normal colonoscopy, but is possible to detect by examining a biopsy of the colon tissue. Microscopic colitis can be distinguished into two subtypes, lymphocytic and collagenous. This APP addresses collagenous colitis, which is characterized by a thick layer of collagen in the colon tissue.
Thus, by quantifying the percentage of collagen in the colon tissue, a diagnosis can be determined.
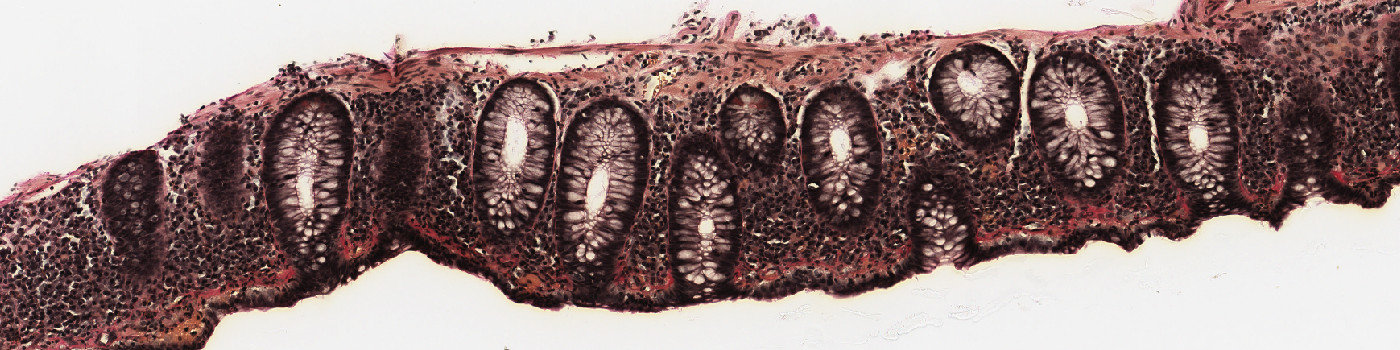
Raw image of colon tissue.
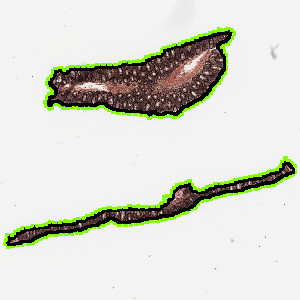
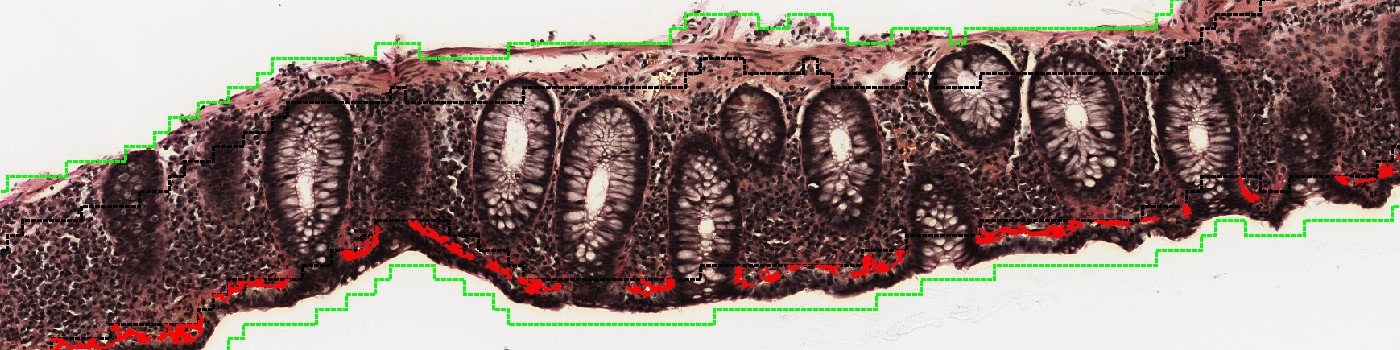
Results of analysis with the Auxiliary APP: “01 Detect ROI”. The colon tissue area has clearly been outlined by a green dashed ROI.
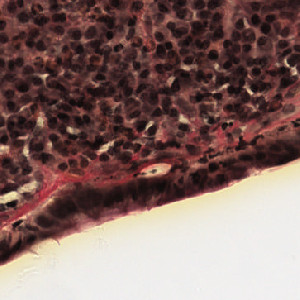
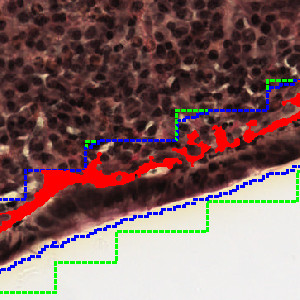
Raw image showing the collagen border.
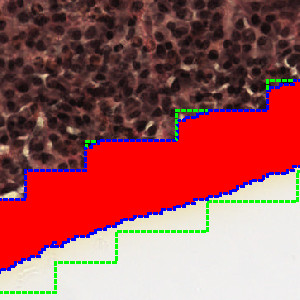
Results of analysis with the Auxiliary APP: “02 Collagen Border”. The collagen border is marked in red.
Auxiliary APPs
ROI detection:
APP: “01 Detect ROI”
The auxiliary APP is used for automatic and precise detection of tissue present in the image, thereby limiting the analysis to only occur within relevant tissue areas and not on the entire image.
Quantitative Output variables
The output variables obtained from this protocol include:
Workflow
Step 1: Load the auxiliary APP for ROI detection “01 Detect ROI”.
tep 2: Load the auxiliary APP for collagen border detection “02 Collagen Border”.
Step 3: Load the quantification protocol “03 Analyze”. This APP provides several output parameters such as “Area Collagen” and “Percentage Collagen”.
Methods
The first image processing step involves an automated detection/outlining of colon tissue area, i.e. the region of interest (ROI) (see FIGURE 2). The collagen border is subsequently detected inside the ROI (see FIGURE 4). The collagen area is found (see FIGURE 5), and the percentage of collagen in the colon tissue is provided.
Staining Protocol
There is no staining protocol available.
Keywords
Colon, colitis, collagenous, Van Gieson, human, digital pathology, image analysis.
References
LITERATURE
1. Fiehn, A-M., et. al., Automated image analysis in the study of collagenous colitis, Clinical and Experimental Gastroenterology 2016, 9, 89-95. DOI