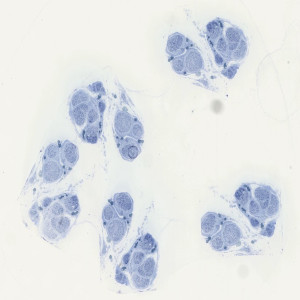
Macroscopic view of toluidine blue stained nervous tissue.
#10142
This protocol can be used for evaluation of nervous tissue. Nerves consist of sensory, motor, and autonomic nerve axons. Particularly those of larger diameter, are surrounded by myelin. This APP can quantify axon cross-sectional area, myelin thickness, and the G-ratio (axon major axis length / myelin major axis length), which is relevant for the study of neurodegenerative diseases and a variety of neuropathies.
The protocol automatically detects cross sections of nerves. Each nerve section is evaluated for large, small, and degenerated nerve fibers. The small and large nerve fibers are partitioned into axon and myelin and important parameters, as major axis length, are exported per axon.
Macroscopic view of toluidine blue stained nervous tissue.
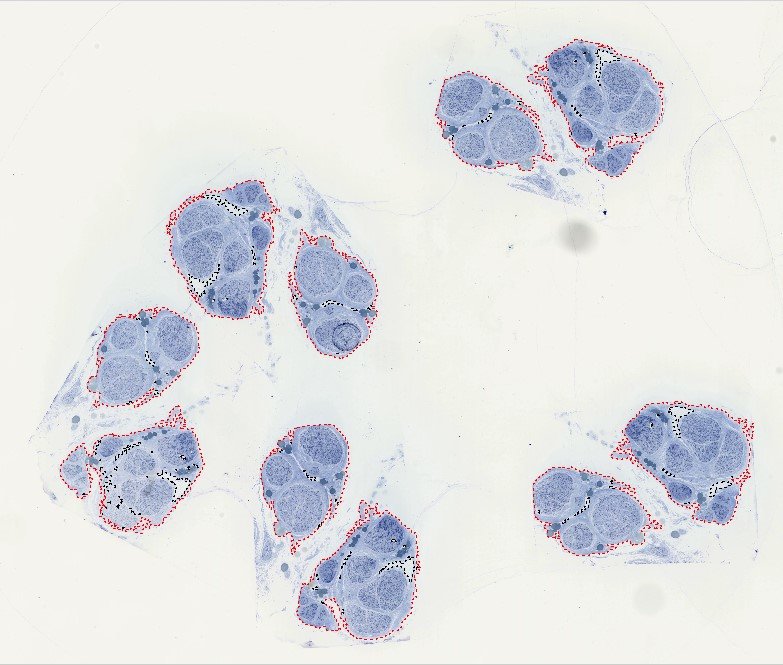
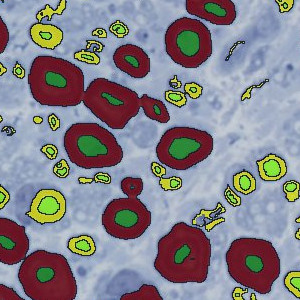
Automatically detected outline of nerves.
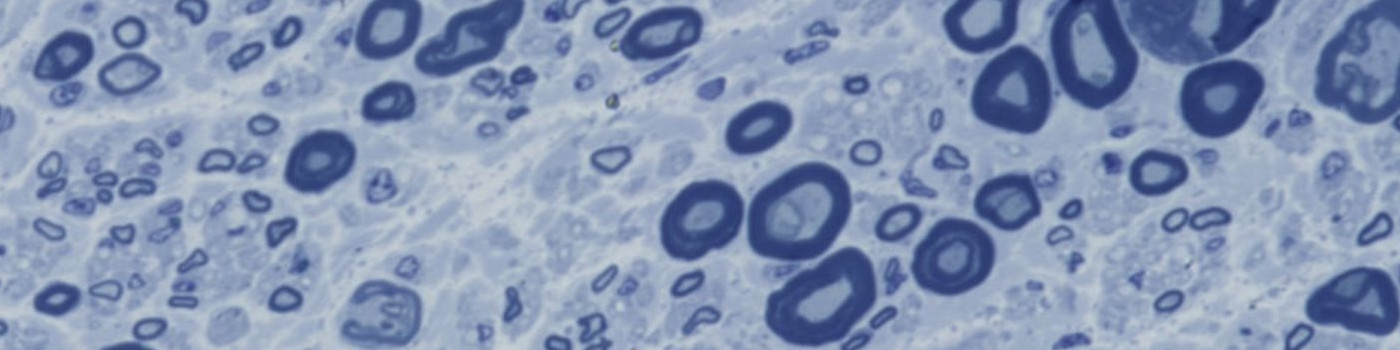
Nervous tissue. Zoom in on Figure 1.
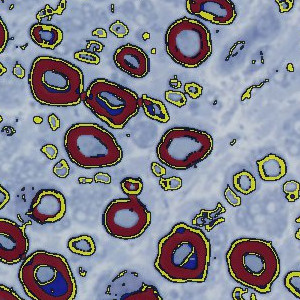
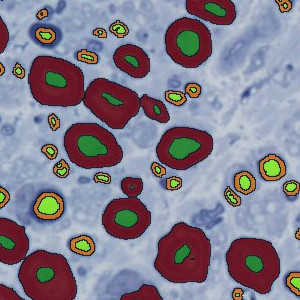
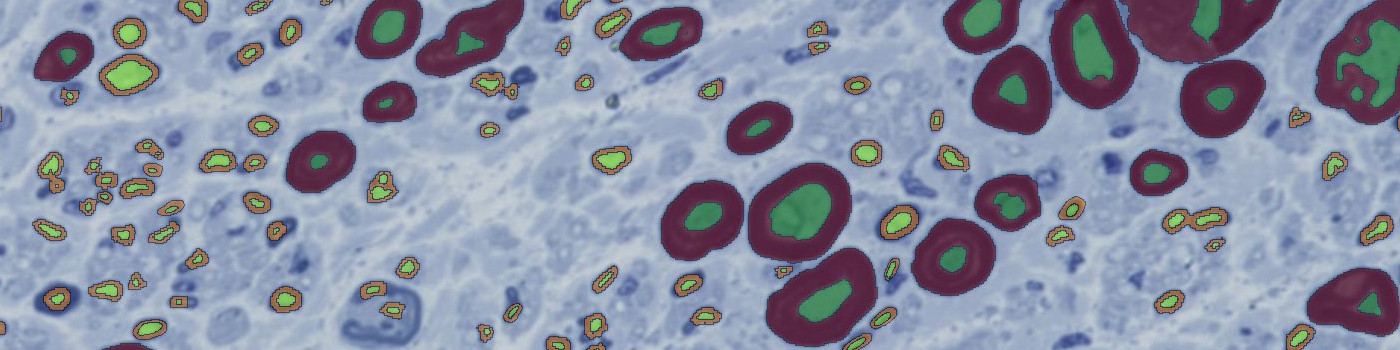
Initial classification of nervous tissue in figure 3.
Quantitative Output variables
The output variables obtained from this protocol are:
1Per object calculations based on all large axon fibers
2Per object calculations based on all small axon fibers
Workflow
Step 1: Load and run the APP “01 Nerve Detection” for nerve identification or manually outline ROIs.
Step 2: Load and run the APP “02 Nerve Quantification” for quantification of nerve fibers (axon+myelin).
Methods
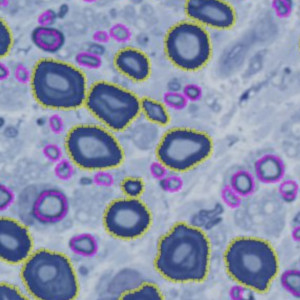
Initially, myelin bands are enhanced using a local linear filter on the intensity of the toluidine stain. Thin and thick myelin bands are differentiated by using two different filter sizes; a large filter for thick myelin bands and a smaller filter for thin myelin bands. An initial threshold classification is used, followed by post processing steps to clean up false detections of nerve fibers. Lastly, different ROIs are generated for small and large nerve fibers, to enable per object outputs for each individual nerve fiber.
Staining Protocol
Nerves were fixed in 2.5 % glutaraldehyde, placed in 1 % osmium tetroxide, dehydrated through a graded series of ethanol and propylene oxide, cut at 0.5 µm, and stained with toluidine blue.
Keywords
Neuroscience, Toluidine Blue, Nerve, Axons, Myelin, G-ratio, Major Axis Length
References
USERS
This APP was developed for Professor Osvaldo Delbono, Wake Forest School of Medicine.
LITERATURE
There are currently no references.