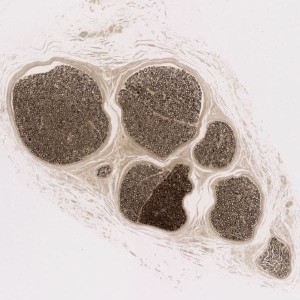
Nerve fiber bundles.
#10075
Peripheral neuropathy is a complication found in a number of different underlying medical conditions or even idiopathic, covering nerve damage in the peripheral nervous system.
Quantitative morphological data from nerve cross sections, such as estimates of the number, density, and size distribution of myelinated fibers at selected levels of roots, spinal tracts, and sampled levels of peripheral nerves, density can be of great value in experimental, developmental, and pathological studies. In previous work, see [1], such samples are used to characterize alterations of motor, sensory, and autonomic neurons and their axons with development, aging and disease.
The summated areas of fascicles may be used in the detection of congenital mal-development, hypertrophy, or edema. The number of fibers per nerve may be increased (as from sprouting) or decreased (as from degeneration). Regression lines relating axonal area to myelin area, myelin thickness, or myelin spiral length may provide evidence of hypertrophy or atrophy of axons, see [1].
Nerve fiber bundles.

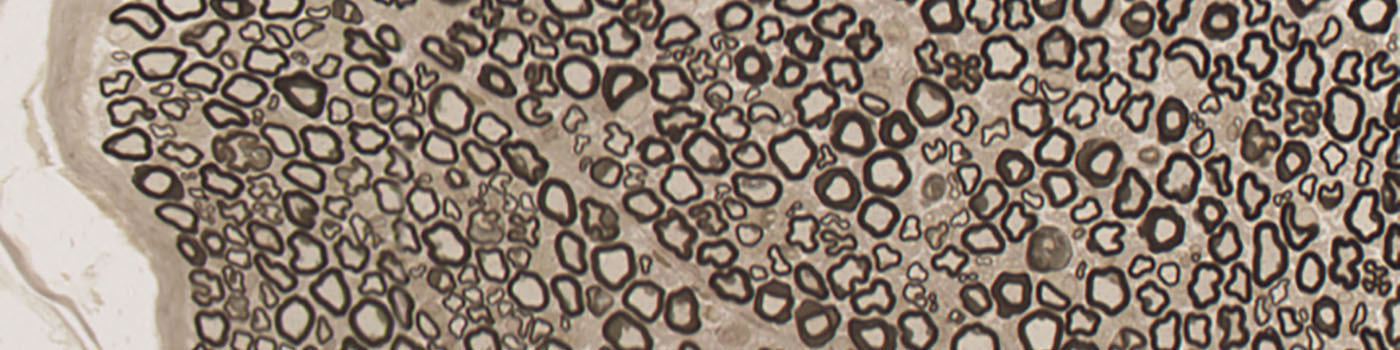
The same image as FIGURE 1, where the nerve fiber bundles have been identified and highlighted with a separate color.
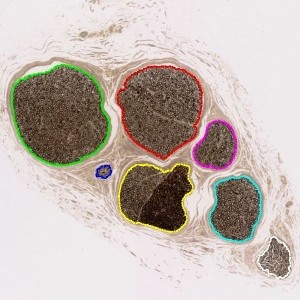
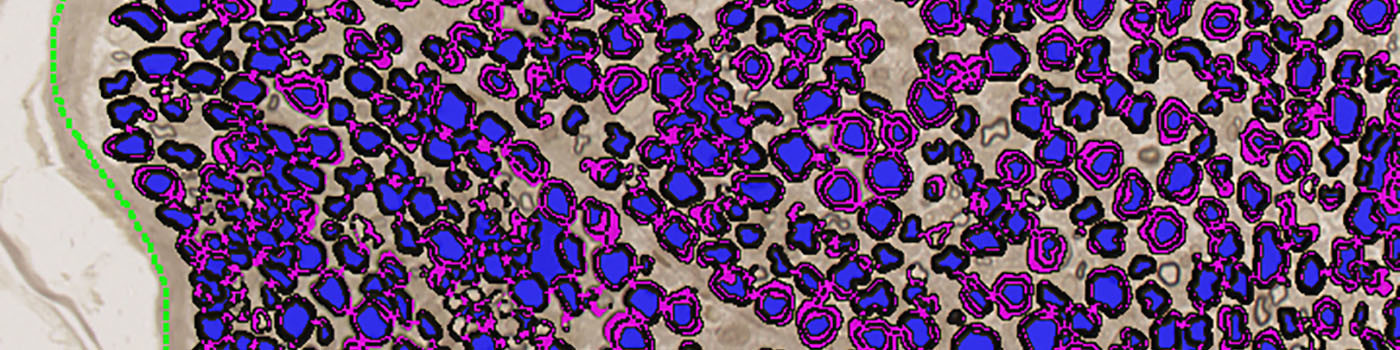
The same image as FIGURE 1 and 2, where each of the bundles are highlighted with a ROI for further analysis.
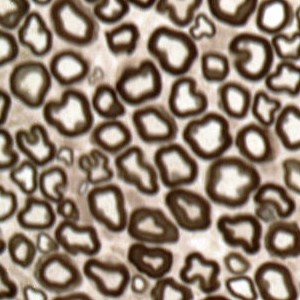
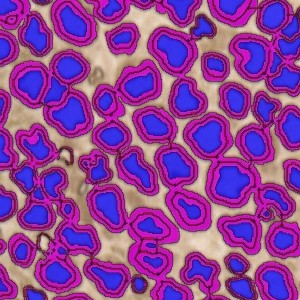
A close-up of a nerve fiber bundle, showing several axons with associated myelin.
Auxiliary APPs
Auxiliary APPs are used for additional process steps, e.g. finding Region of Interest (ROI).
APP: 01 – NERVE DETECT
This auxiliary APP can be used to automatically detect a ROI. The ROI is generated by distinguishing nerve fiber bundles from tissue and background.
Quantitative Output variables
Four outputs are obtained from this protocol, and one from the auxiliary APP:
Workflow
Step 1: Load and run the auxiliary APP for nerve fiber detection “01 – Nerve Detect’.
Step 2: Load and run the quantification protocol “03 – Fiber Quantification’. Click the save button to transfer the results to the database.
Methods
The first step of the analysis is performed using the auxiliary APP designed to automatically detect the nerve and calculate the area and diameter of each fiber bundle within the nerve. In the next step, each of the nerve fiber bundles are quantified at a higher magnification, determining the number of fibers per nerve and total in the section, while excluding odd shaped objects that are not likely to be nerves. From this the myelin can be identified and measured.
It should be noted that the fiber end-points will at best only be semi-quantitative with image analysis. To get a truly quantitative, unbiased estimate of fiber thickness, number and area it is recommended to use a Stereological approach.
Keywords
Peripheral nerve, axon area, axon perimeter, nerve, myelin sheath thickness, index of dispersion, neuropathy
References