
Field of view showing invasive tumor in lung tissue stained by RISH.

#10151
Programmed death-ligand 1 (PD-L1) is a transmembrane protein that binds to the inhibitory receptor programmed death 1 (PD-1) causing a down regulation of immune responses. PD-L1 is typically expressed on normal cells but has been observed on tumor cells while PD-1 is typically expressed on certain immune cells [1]. Tumor cells can upregulate PD-L1 expression and avoid being attacked by the body’s immune system, making an interruption of the PD-1/PD-L1 interaction an attractive method for assisting the immune system in destroying tumor cells, see [2].
Assessment of PD-L1 can be achieved by use of immunohistochemistry (IHC), however, the activity of the PD-L1/PD-1 axis can also be assessed directly at the transcriptomic level using RNA in situ hybridization (ISH) techniques.
This APP works on RNAscope images and automatically detects cells and probe signals. The cells are classified according to the number of probes associated with the cells and a composite score is calculated and reported.
Field of view showing invasive tumor in lung tissue stained by RISH.

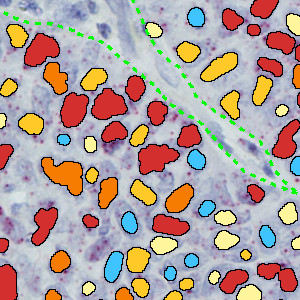
Same field of view with manually outlined tumor.
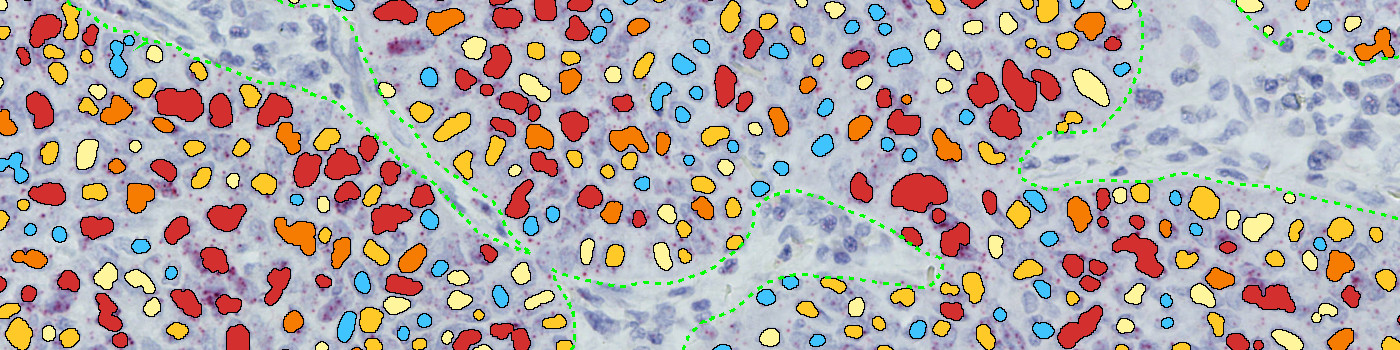
Same field of view with classification results. The blue labels indicate 0+ cells, the bright yellow labels indicate 1+ cells, the dark yellow labels indicate 2+ cells, the orange labels indicate 3+ cells, and the red labels indicate 4+ cells.
Quantitative Output variables
The output variables obtained from this protocol are:
Workflow
Step 1: Manually outline regions of interest (ROIs)
Step 2: Load and run the APP 10151 – PD-L1-RISH, LUNG CANCER, TME
Methods
The APP initially detects nuclei and probe signals inside the outlined region of interest. The nuclei detection is based on the hematoxylin color-deconvolution band along with a polynomial blob filter that enhances their shape. The contrast between the red and the green color bands leads to an exposure of the probe signals which are then detected. In the post-processing, morphological noise is removed from the nuclei and adjacent nuclei are separated using a watershed algorithm. The size of the probe signals is used to determine the number of probes present in a probe cluster and the cells are classified according to the estimated number of probes within the nuclei.
Staining Protocol
There is no staining protocol available.
Keywords
PD-L1, RISH, In situ hybridization, Lung cancer, Digital pathology, Image analysis
References
USERS
This APP was developed for Drs. Stephen P. Finn and Steven Gray, St. James’s Hospital and University of Dublin, Trinity College, Ireland.
LITERATURE
1. Zou, W., Chen, L. Inhibitory B7-family molecules in the tumour microenvironment. Nature Reviews Immunology 2008, 8 (6), 467-477, DOI.
2. Pardoll, D. M. The blockade of immune checkpoints in cancer immunotherapy. Nature Reviews Cancer 2012, 12 (4), 252-264, DOI.