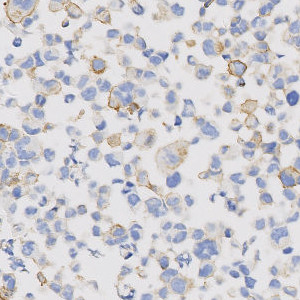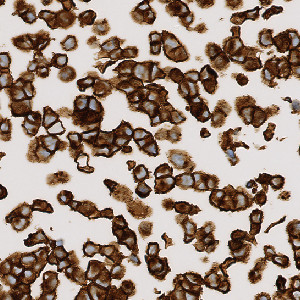
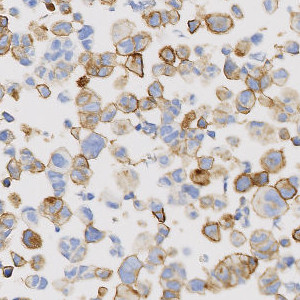
Zoomed in image of a strong postive cell line core.
#10092
The availability of genetically defined reference materials, offers an industry standard for development and quality control of IHC assays, directly, thereby improving the accuracy and reproducibility. Using engineered cell lines as quality control material to assess the performance of IHC assays eliminates the variability associated with patient-derived reference standards.
This APP can be used for quality control of PD-L1 strong positive, intermediate positive, weak positive and negative cell line material to ensure that each cell line block complies with the expected PD-L1 expression before the material is used as reference standard for IHC assays. The APP quantifies the PD-L1 expression in each cell line core and relates this expression to a known reference value for each cell line expression level.
Zoomed in image of a strong postive cell line core.
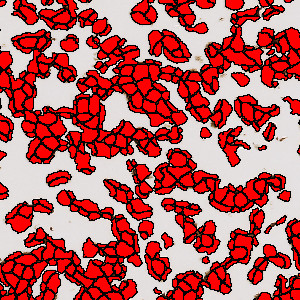
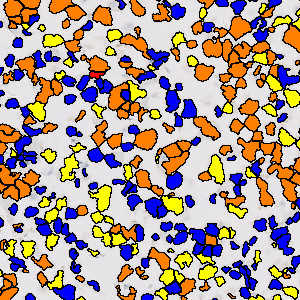
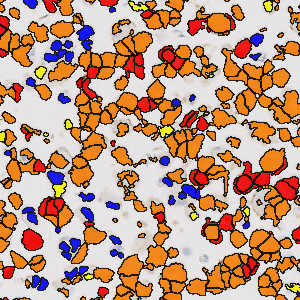
The image from FIGURE 1, analyzed with the APP. Strong positive nuclei (3+) are labeled red, intermediate (2+) orange, weak (+1) yellow, and negative blue.
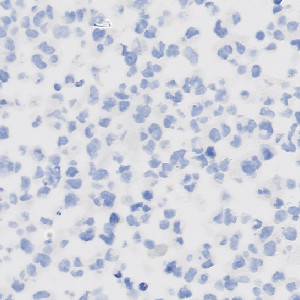
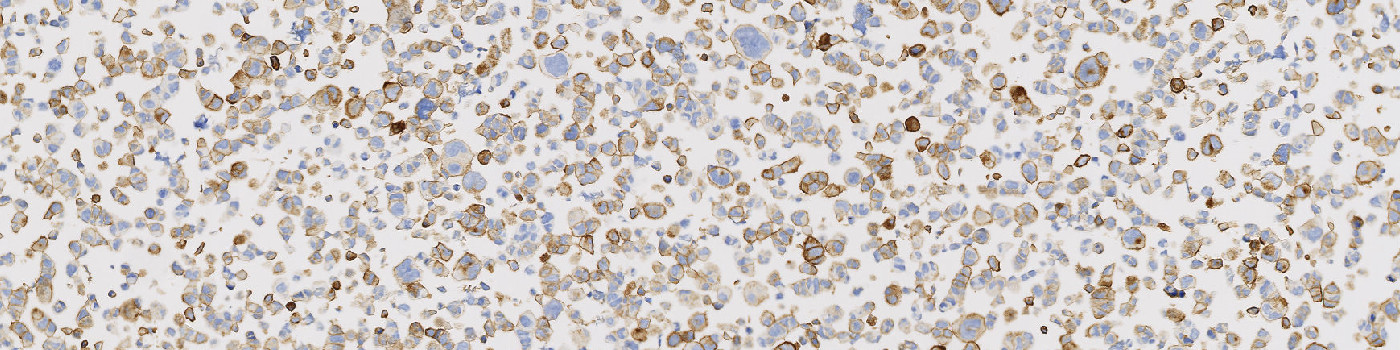
Zoomed in image of an intermediate positive cell line core.
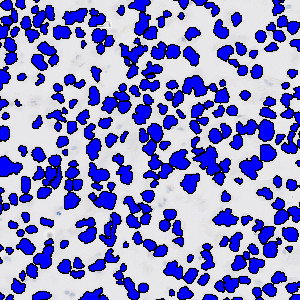
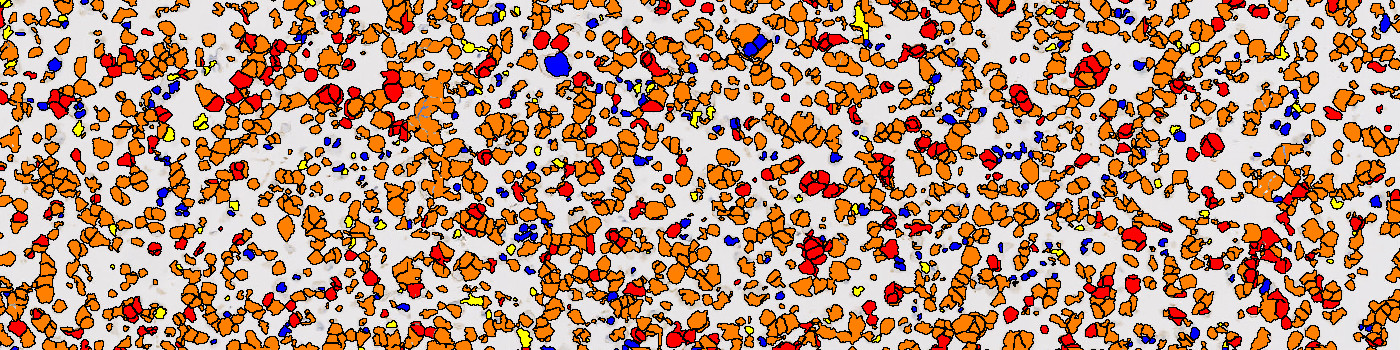
The analyzed intermediate positive cell line core in FIGURE 3, demonstrating the detection of the varying staining intensity. Strong positive nuclei (3+) are labeled red, intermediate (2+) orange, weak (+1) yellow, and negative blue.
Quantitative Output variables
The output variables obtained from this protocol are:
Methods
The first image processing step involves a segmentation of all nuclei in the ROI (see FIGURE 2 and 3). This is done by using an HDAB-DAB color deconvolution band to detect positively stained nuclei and the Haematoxylin-HDAB color deconvolution band to detect negative nuclei. The color deconvolution bands are input to a K-means classifier. A method for nuclei separation which is based on shape, size and nuclei probability is used, employing a fully automated watershed-based nuclei segmentation technique. Then the positive nuclei are subdivided into three categories based on staining intensities. As a post-processing step, nuclei areas that are too small are removed. The image obtained after post-processing (see e.g. FIGURE 3), is used for quantifying the PD-L1 expression in each cell line core based on the H-score. As a final step the H-score is related to a known reference value for each cell line expression level.
Staining Protocol
There is no staining protocol available.
Keywords
PD-L1, cell line, quality control, reference standards, image analysis.
References
USERS
The APP was developed for Horizon cell lines.
LITERATURE
There are currently no references.