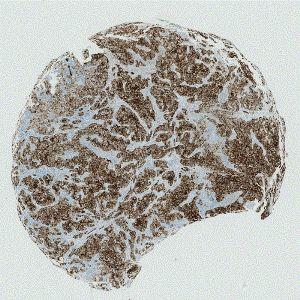
The original TMA-core stained with PCK.


#10165
Developed for tumor detection in PCK stained breast tissue
This APP has been developed to improve quantification of ER, PR or Ki-67 positive cells within breast carcinoma, by automatically identifying tumor areas. The APP uses the Virtual Double Staining (VDS) technique, which enables automated and robust detection of tumor regions.
Two serial sections stained for ER/PR/Ki-67 and Pancytokeratin (PCK), respectively, must be used in this APP. Tumor regions are identified automatically on the PCK stained slides and the outlined tumor region are overlaid on the biomarker stained slide, thus automatically outlining the tumor regions in the other stain.
In EU/UK: CE IVD – for use in diagnostic procedures
The original TMA-core stained with PCK.
The original TMA-core stained with ER. APP workflow is the same for PR or Ki-67.
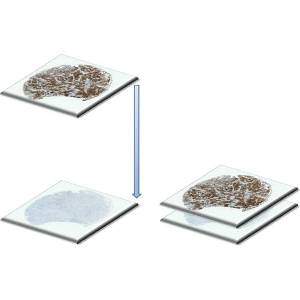
Tissue alignment. The PCK and ER (PR/Ki-67) TMA-cores are aligned, one on top of the other.

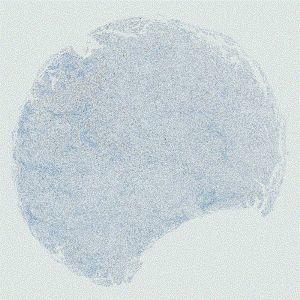
Part of tissue stained with PCK.
Quantitative Output variables
The output consists of one or more ROIs, outlining the tumor areas. The output variable obtained from this protocol is:
Workflow
Step 1: Load and run the APP “10165 – PCK VDS, Tumor Detection” in a region on the image of interest
Methods
To employ the VDS approach for ER, PR or Ki-67, two serial sections must be stained for ER/PR/Ki-67 and PCK, respectively. This APP works as a three-step process as described below.
First, alignment of the two serial sections (see FIGURE 3). The alignment is done both on a large scale, and on a finer detailed level, to get the best possible match of the two tissue sections.
Second, the tumor areas are automatically detected from the PCK slide and outlined as regions of interest (ROIs) (see FIGURE 4 and 5). The ROIs are then superimposed on the aligned ER/PR/Ki-67 tissue slide to outline the tumor region for subsequent analysis limited to the inside of the tumor regions.
