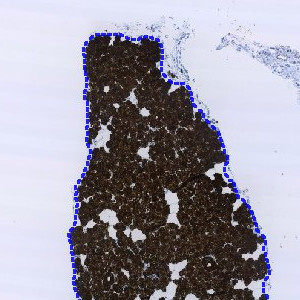
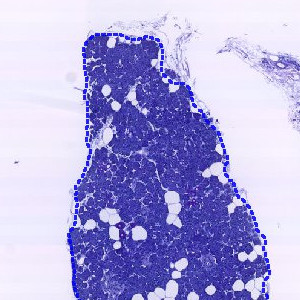
Salivary glands stained with CKAE1/AE2. The blue ROI shows automatic detection of glandular region.
#10126
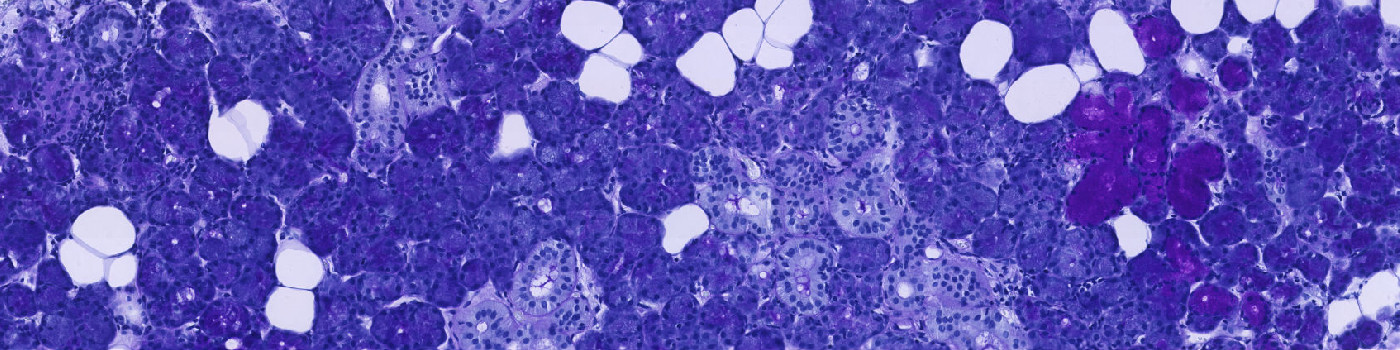
Periodic acid-Schiff (PAS) is a staining method that can be used to detect mucosubstances in tissues, see [1]. Mucin expression has been shown to correlate with tumor grade and type in salivary gland neoplasms, see [2][3][4], and can be detected using PAS staining, see [5].
This APP uses PAS staining for identification of mucosubstances in tissue sections from salivary glands. It automatically detects glandular regions of interest and differentiates between mucus and serous glands.
Salivary glands stained with CKAE1/AE2. The blue ROI shows automatic detection of glandular region.
Salivary glands stained with PAS. Because of alignment the blue ROI detected on the CK AE1/AE3 slide can also be seen on the PAS slide.
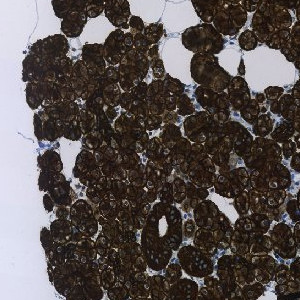
Salivary glands stained with CKAE1/AE2.
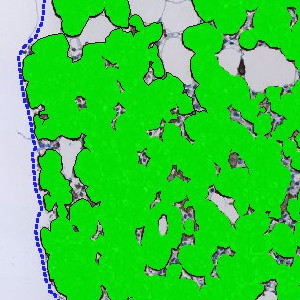
Classification of glandular areas (green). See original tissue without classification in FIGURE 3.
Auxiliary APPs
APP: “01 Outline Glandular Area”
The auxiliary APP “01 Outline Glandular Area” is used for automatic outline of the major glandular areas.
Quantitative Output variables
The output variables obtained from this APP are:
02 Quantify CK AE1_AE2 Area
03 Quantify PAS Area
Workflow
Step 1: Align the PAS and CK AE1/AE3 stained serial slides
Step 2: Load and run the protocol “01 Outline Glandular Area” for outline of glandular areas and manually correct if necessary
Step 3: Load and run the protocol “02 Quantify CK AE1_AE2 Area” for classification of glandular areas
Step 4: Load and run the protocol “03 Quantify PAS Area” for quantification of mucous and serous glands
Methods
The protocol works on a virtual double stain (VDS) of PAS and CK AE1/AE2 stained serial sections. Initially, the outer boundary of the glandular area is outlined by thresholding the brown feature HDAB-DAB of the CKAE1/AE2 slide. FIGURE 1 and 2 show the aligned sections with outline. In case of artefacts, such as tissue folds etc., the outline should be manually corrected.
Glandular areas within the ROI are classified by thresholding the intensity of the CK AE1/AE2 slide, providing a ratio of glandular tissue to connective/adipose tissue. The classification of glandular tissue is shown in green in FIGURE 3 and 4.
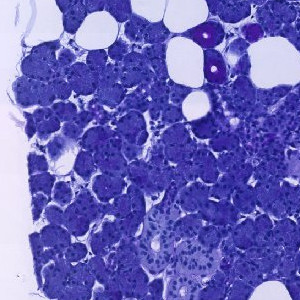
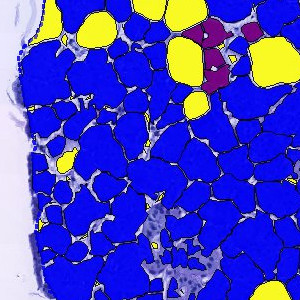
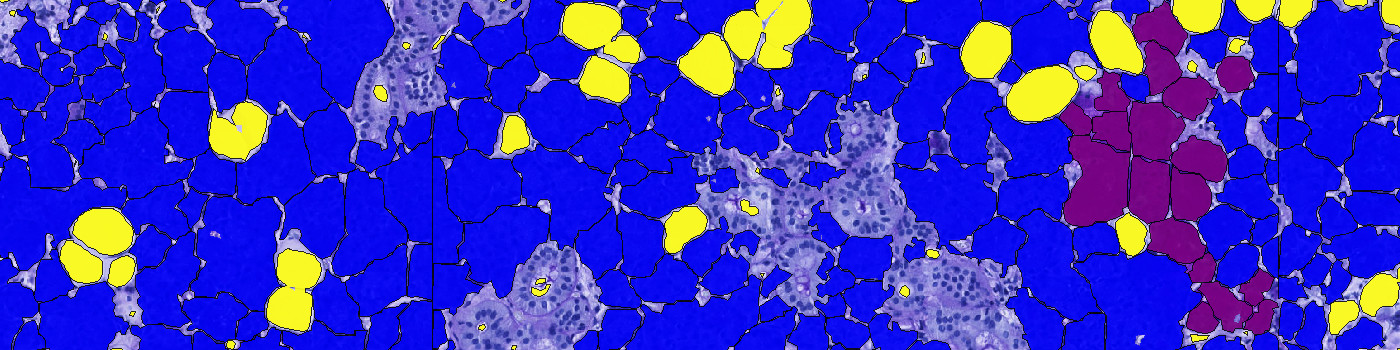
Finally, the ROI in the PAS slide is classified into mucous glands, serous glands, adipose tissue, and connective tissue/export channels. The classification of serous glands, adipose tissue, and connective tissue/export channels is based on the red intensity, while the mucous glands are classified based on an H&E Eosin feature. The classification is seen in FIGURE 5 and 6. The areas of mucous glands, serous glands, adipose tissue, and connective tissue/export channels are calculated for each class.
Staining Protocol
There is no staining protocol available.
Keywords
periodic acid-Schiff, PAS, CK, AE1/AE2, salivary glands, cancer, mucous glands, serous glands, density, image analysis, mucosubstances
References
USERS
The APP was developed for Christian Grønhøj Larsen and David Hebbelstrup Jensen, Department of Otolaryngology, Head and Neck Surgery, Rigshospitalet.
LITERATURE
1. McManus, J. F. A. Histological demonstration of mucin after periodic acid, Nature 1946, 158 (4006), 202, DOI.
2. Mannweiler, S., Beham, A., & Langner, C. MUC1 and MUC2 expression in salivary gland tumors and in non‐neoplastic salivary gland tissue, Apmis 2003, 111 (10), 978-984, DOI.
3. Namboodiripad, P. C. A. A review: Immunological markers for malignant salivary gland tumors, Journal of Oral Biology and craniofacial research 2014, 4 (2), 127-134, DOI.
4. Llupi, M., Qoku, R. Expression of mucins in normal salivary glands and mucoepidermoid carcinoma of salivary glands, Malmø University, Master thesis, 2013, DOI.
5. Panicker, N. K., Jariwala, P. H, Buch, A. C., Joshi, M. The utility of periodic acid schiff with diastase and alcian blue stains on fine needle aspirates of breast and salivary gland neoplasms, Journal of Cytology/Indian Academy of Cytologists 2012, 29 (4), 221, DOI.