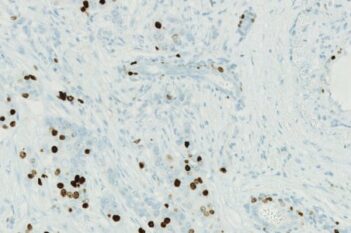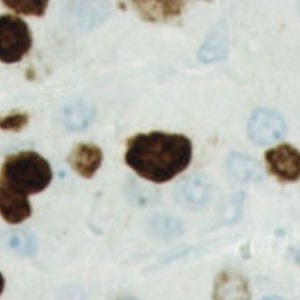
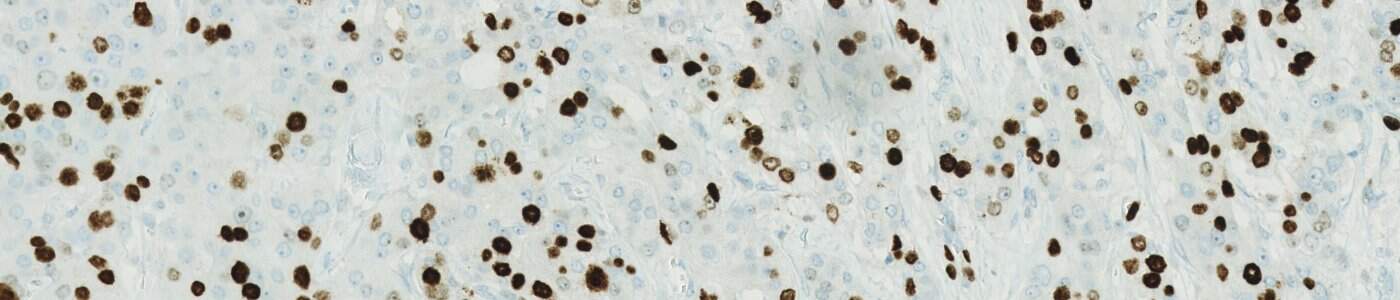
Pre-processed breast tissue with visible DAB staining.
#10189
The Quickstart APP performs automated segmentation of nuclei, quantifies 3,3′-Diaminobenzidin (DAB) staining intensity, and classifies each nucleus as either negative or positive. Positive nuclei are further stratified into three intensity levels (1+, 2+, and 3+) based on predefined thresholds, which are configurable in APP Author. After analysis is complete, you may explore your results with the Phenoplex™ Guided Workflow or the Data Exploration and QC tool.
As with all of the Quickstart APPs, your image analysis can be scaled by queueing APPs to run in the background on an unlimited number of images and cores—this is possible with the “batch analysis” feature available on both Discovery and Phenoplex™.
Working with multimodal data sets or TMAs? No problem. Run this APP after using the Tissuealign™ feature to align your images at the cellular level, or the Tissuearray™ feature to de-array your tissue cores.
Pre-processed breast tissue with visible DAB staining.
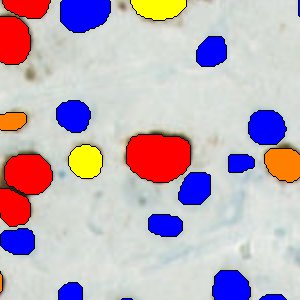
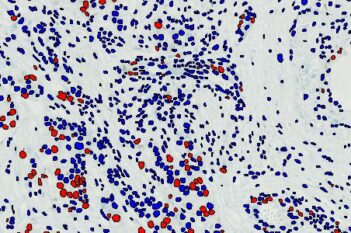
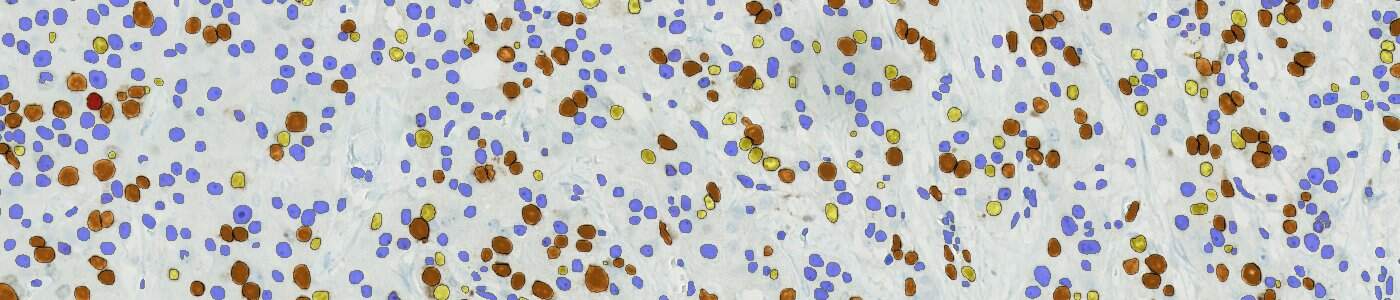
Post-processed breast tissue. The blue cells are DAB negative. Yellow cells indicate weakly positive nuclei (1+). Orange cells indicate moderately positive nuclei (2+). Red cells are strongly positive for DAB (3+).
Quantitative Output variables
Workflow