Nuclei surrounded by intermediate and strong NT positive staining.
#10135
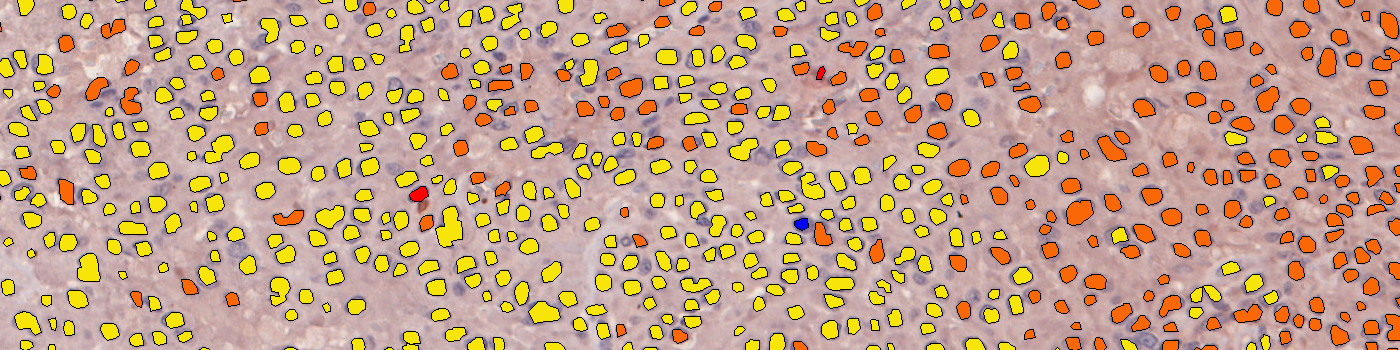
NT (nitrotyrosine) is generated on the tyrosine residues in the specific proteins, which represents a marker of oxidative stress associated with protein dysfunction. Increased nitrotyrosine expression in tumor cells predicts poor outcome of the disease. Immunohistochemical detection of increased levels of protein-associated nitrotyrosine is widely used as a surrogate marker of in situ inflammation.The “10135 – NT, Melanoma, TME” APP detects nuclei and classifies them as either negative, 1+, 2+ or 3+ based on the NT staining expression present in each nucleus’ vicinity.
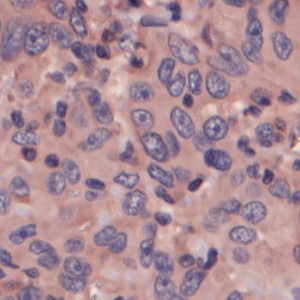
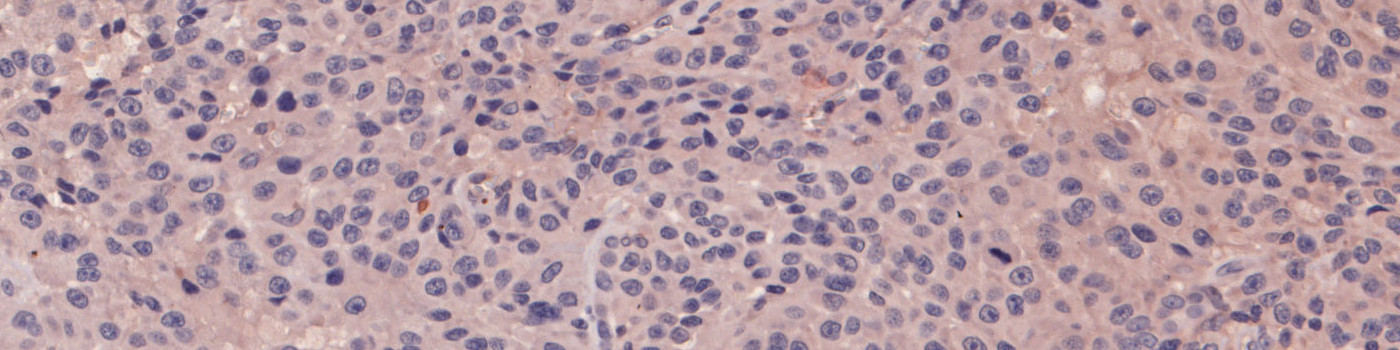
Nuclei surrounded by intermediate and strong NT positive staining.
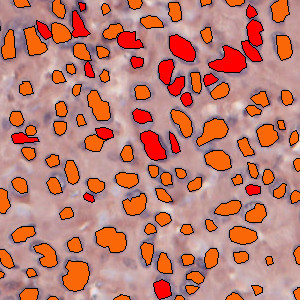
Nuclei classified as 2+ (orange) or 3+ (red) based on the NT staining of each nucleus’ surroundings.
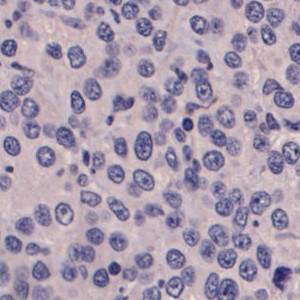
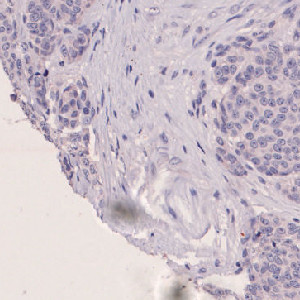
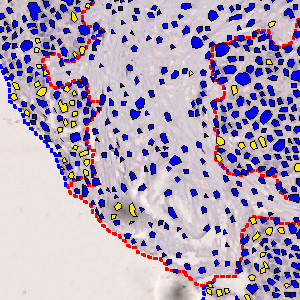
Nuclei surrounded by NT negative and weak NT positive.
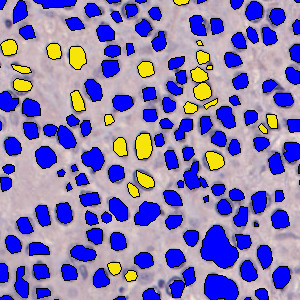
Nuclei classified as negative (blue) or 1+ (yellow) based on the NT staining of each nucleus’ surroundings.
Auxiliary APPs
APP: “01 Detect TumorStroma”
The auxiliary APP: “01 Detect TumorStroma” is used for automatic tumor and stromal tissue detection. The analysis APP will then provide results for tumor and stromal tissue separately.
Quantitative Output variables
The output variables obtained from this protocol include:
Workflow
Step 1: Load and run the APP “01 Detect TumorStroma” for tumor and stromal tissue identification. Manually correct result if needed.
Step 2: Load and run the APP “02 NT Analysis” for the quantification of cells.
Methods
To identify the nuclei, the APP performs a two-stage polynomial blob filtering on a blue-enhanced feature image and delimits them using local linear filtering. Each pixel with DAB staining is classified as low, mid and high based on the intensity and grouped together locally. Each nucleus is then classified based on its surroundings in the order of 3+, 2+, 1+ and negative to emphasize the strongest staining present in each nucleus’ vicinity.
Staining Protocol
There is no staining protocol available.
Keywords
NT, nitrotyrosine, melanoma, skin, cancer, oncology, IHC, tumor micro environment
References
LITERATURE
There are currently no references.