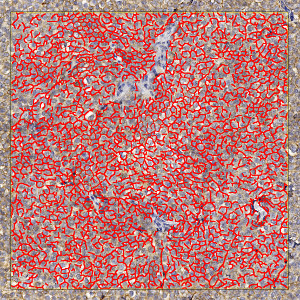
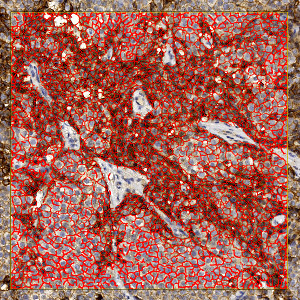
Field of view showing a tumor region in an image of a breast tissue section analyzed by IHC for NHE1. The automatically detected and quantified membrane is labeled (red).
#10025
Mammalian sodium/proton exchangers (Na+/H+) function in intracellular pH (pHi) and cell volume homeostasis by catalyzing an electroneutral exchange of extracellular sodium and intracellular hydrogen. The NHE family of ion exchangers includes six isoforms (NHE1 to NHE6). The only ubiquitously expressed isoform, NHE1, localizes to the plasma membrane. Through its effects on intracellular pH and cell volume homeostasis, this protein regulates a number of cellular properties such as adhesion, migration and proliferation, all of which play an important role in cancer cell invasion.
This APP can be used for quantification of NHE1 membrane immunoreactivity. The parameters used in the APP allow measurement of the expression of sodium/proton exchangers at the plasma membrane in tissue sections. As the function of sodium/proton exchangers relates to their localization, quantitative assessment of localized expression will presumably correlate with function. Comparison of matched sets of samples (e.g. tumors versus normal) allows correlation of expression as a function of (disease) status.
Field of view showing a tumor region in an image of a breast tissue section analyzed by IHC for NHE1. The automatically detected and quantified membrane is labeled (red).
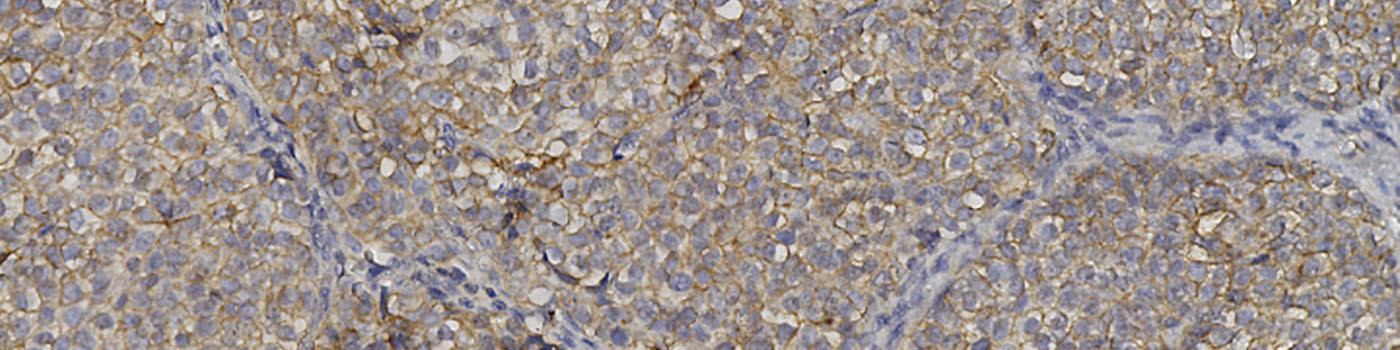
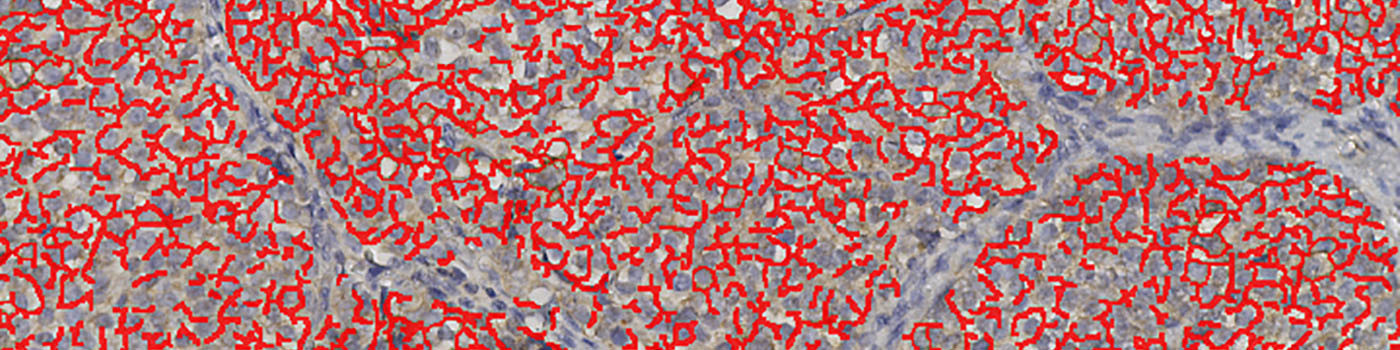
Field of view showing a tumor region in an image of a breast tissue section (different from the one in FIGURE 1) analyzed by IHC for NHE1. Even when there is substantial cytoplasmic staining for NHE1 in some cells, the automatic detection and quantification is restricted to stained membrane.
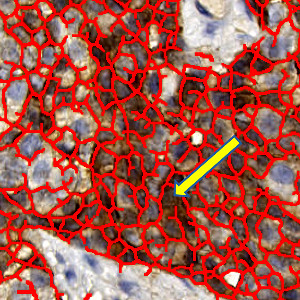
Higher magnification of FOV in FIGURE 2 illustrating the specificity of membrane staining recognition (yellow arrow points to cell with strong cytoplasmic staining).
Quantitative Output variables
The output from this APP consists of three measured endpoints:
The connectivity is calculated from the size distribution of stained membrane fragments within the ROI, where the size of a membrane fragment is defined as the area of the pixels it is composed of, see [1].
The combination of membrane area for stained membranes, mean stain intensity and the connectivity allows for an accurate evaluation of mean membrane expression in tissue sections.
Methods
To detect the membrane, a negated version of the DAB color deconvolution of the image is used as input feature together with a DAB color deconvolution of the image that has been filtered with a polynomial local linear filter. The features are given as input to a threshold classifier. As a post processing step, membrane fragments that are too small are removed. Finally the detected membrane is outlined with a label and used to calculate the quantitative output.
Keywords
Breast cancer, sodium/proton exchangers, NHE1, membrane area, mean stain intensity, membrane connectivity, quantitative, digital pathology, image analysis.
References
LITERATURE
1. Brügmann, A., et. al. Digital image analysis of membrane connectivity is a robust measure of HER2 immunostains, Breast Cancer Res. Treat 2012, 132 (1), 41-9, DOI
2. Putney, L.K., et. al. The changing face of the Na+/H+ exchanger, NHE1: structure, regulation, and cellular actions, Annu. Rev. Pharmacol. Toxicol. 2002, 42 (1), 527-552, DOI
3. Slepkov, E.R., et. al. Structural and functional analysis of the Na+/H+ exchanger, Biochem. J. 2007, 401 (3), 623-33, DOI
4. Bellizzi, A., et. al. Na+/H+ exchanger regulatory factor 1 expression levels in blood and tissue predict breast tumor clinical behavior, Histopathology 2011, 58 (7), 1086-95, DOI
5. Lauritzen, G., et. al. NBCn1 and NHE1 expression and activity in DeltaNErbB2 receptor-expressing MCF-7 breast cancer cells: contributions tp pHi regulation and chemotherapy resistance, Exp. Cell Res. 2010, 316 (15), 2538-53, DOI
6. Celis, J.E., et. al. Molecular characterization of apocrine carcinoma of the breast: validation of an apocrine protein signature in a well-defined cohort, Mol. Oncol. 2009, 3 (3), 220-37, DOI