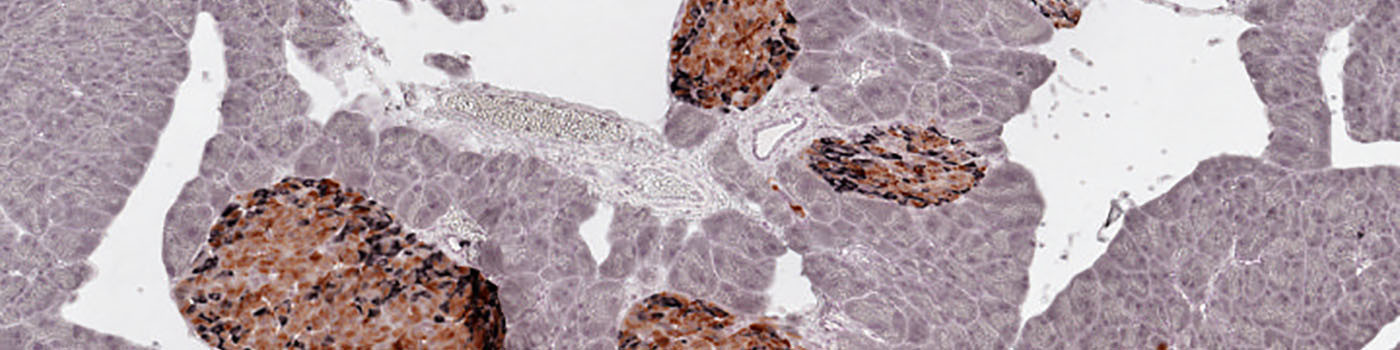
Whole slide image of pancreas tissue.
#10044
The endocrine pancreas has a significant remodeling capacity and plasticity that plays an essential role in the maintenance of glucose homeostasis. It is now well accepted that beta-cell mass is dynamic and adjusts to meet the changes in metabolic demand, both in physiological and in pathological conditions. Despite an increased focus on the beta cell dynamics in pharmacological settings, the application of reliable techniques is still needed. Stereological methods have been developed and tested but are usually hampered by the low efficiency in terms of time. The combination of new digital platforms, image analysis software and new stereological sampling techniques are believed to revolutionize the quantitative assessment of beta cell dynamics. This APP calculates the Beta cell and Non-beta cell areas, and the results have been validated using stereological point counting methods.
Whole slide image of pancreas tissue.
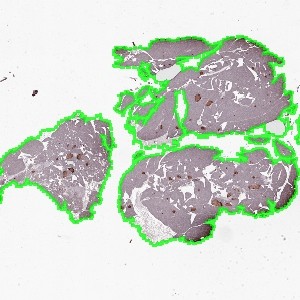
The same image as in FIGURE 1 after automated tissue outlining by the auxiliary APP Mouse Pancreas, Beta- and Non-beta Cell Area – 01 Tissue detect.
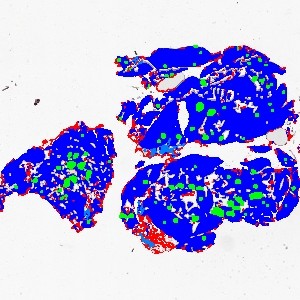
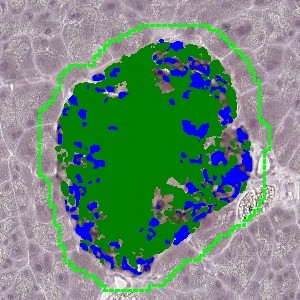
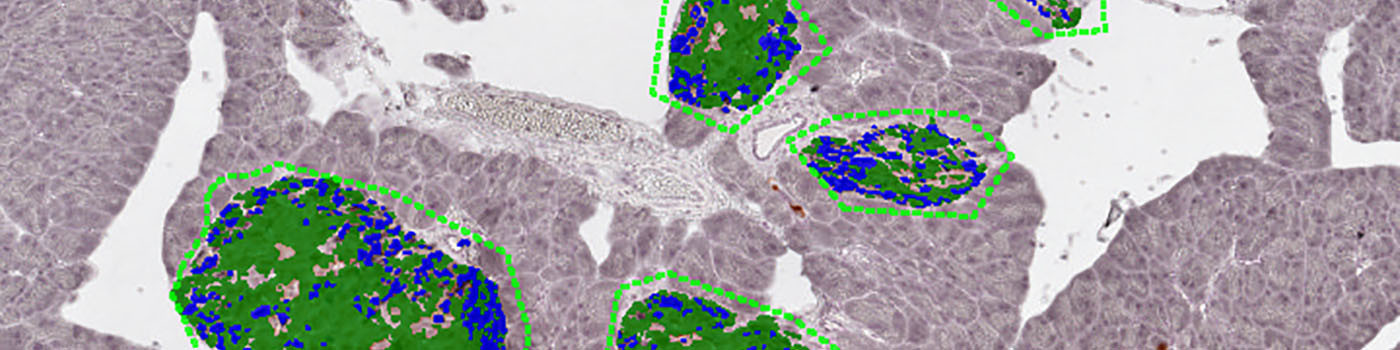
The same image as in FIGURE 1 after automated tissue component analysis using the auxiliary APP Mouse Pancreas, Beta- and Non-beta Cell Area – 02 Tissue Components with the label layer settings on. The colors show the different tissue components: Islets (green label), Exocrine tissue (dark blue label), Fat (red label), Vessels (light blue label), Lymph (pink label).
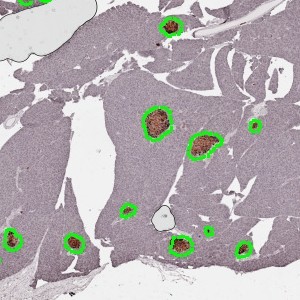
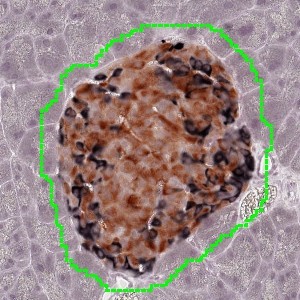
Close-up on part of FIGURE 1 showing the automated identification of islets (green ROI outlining) achieved by the tissue component analysis using the auxiliary APP Mouse Pancreas, Beta- and Non-beta Cell Area – 02 Tissue Components with the ROI outlining settings on, and the label layer settings off.
Auxiliary APPs
Auxiliary APPs are used for additional process steps, e.g. finding Region of Interest (ROI).
ROI DETECT
The auxiliary APP ’01 Tissue detect’ can be used to automatically detect the region of interest (ROI). This is to save time in the subsequent analysis steps. The analysis is carried out at 0.5x magnification and finds larger pieces of tissue. Dust and small artifacts are ignored. There are no quantitative output variables from this step [see Examples: figure 1 and 2].
TISSUE COMPONENT DETECTION
The auxiliary APP ’02 Tissue Components’ segments the tissue into different components: Pancreas exocrine, vessel, fat, lymph and islets. The islets are dilated (enlarged) to ensure nothing is missed and turned into individual ROIs.
Quantitative Output variables
The quantitative output variables are created in several steps of the analysis process. The initial segmentation of the tissue is used to derive information on pancreatic area (i.e. exocrine, vessels and dilated islets). Further results are derived from the final quantification.
Methods
The first image processing step outlines the tissue with a Region Of Interest (ROI). This is to save time in the subsequent analysis steps. The analysis is carried out at 0.5x magnification and finds larger pieces of tissue. Dust and small artifacts are ignored. There are no quantitative output variables from this step.
The second image processing step segments the tissue into different components and takes the varying staining intensity along the edges of the tissue into account. The tissue is segmented into pancreas exocrine, vessel, fat, lymph and islets. The islets are dilated (enlarged) to ensure that nothing is missed and before they are converted into individual ROIs.
The final quantification will segment the islets into beta cells, non-beta cells and empty space.
Staining Protocol
BETA- AND NON-BETA CELL IMMUNOHISTOCHEMISTRY
The paraffin embedded sections were processed for double immunohistochemistry in one of the following combinations:
1 antibody to insulin and an antibody cocktail to pancreatic polypeptide (pp), somatostatin and glucagon,
2 antibodies to insulin and Ki67,
3 antibodies to insulin and TUNEL.
The sections were immunostained manually using optimized staining protocols with DAB and DAB-nickel as chromagens according to protocols from Gubra. Staining protocols could potentially be optimized to avoid possible tissue edge artifacts.