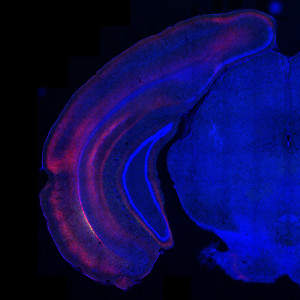
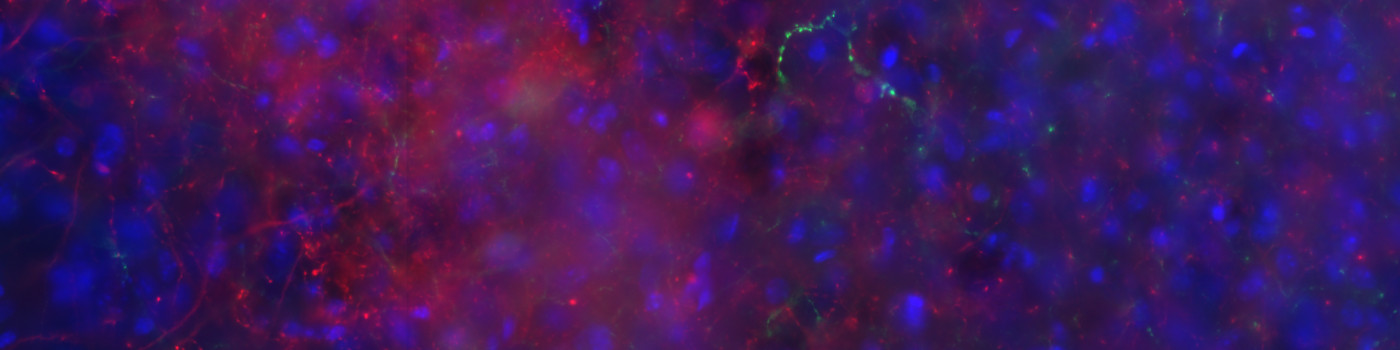
Macroscopic view of mouse brain tissue stained with DAPI, GFP and mCherry
#10158
Developed for the University of Edinburgh, Scotland
Fluorescent labelling of neurons is a well-established method used to trace the circuitry of the brain, and it is often the first step in identifying the targets of a brain region of interest. Some neurons in the brain branch extensively, sending long-range projections across the brain. In these cases, a brain-wide quantification of axon density in the different brain areas is necessary for identifying which areas these neurons are targeting, as well as the strength of innervation in these areas. For neurons that have been stained with mCherry and/or GFP, APP “10158 – mCherry+GFP, Axon Density” can be used to quantify axon density across brain areas by measuring fluorescence density in brain sections. Fluorescence density is measured as the fraction of pixels in a given area that are above a set threshold value. The APP returns the list of brain areas and their fluorescence density levels. This APP can also be modified to detect pre-synaptic targets that are labelled via retrograde tracing methods.
Macroscopic view of mouse brain tissue stained with DAPI, GFP and mCherry
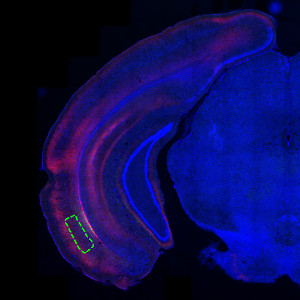
Macroscopic view of mouse brain tissue stained with DAPI, GFP and mCherry with an outlined region of interest
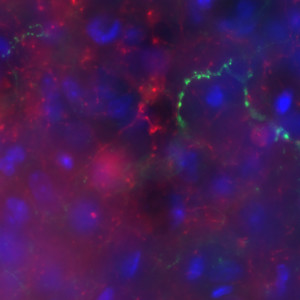
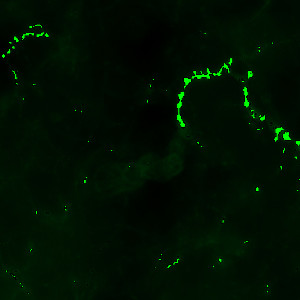
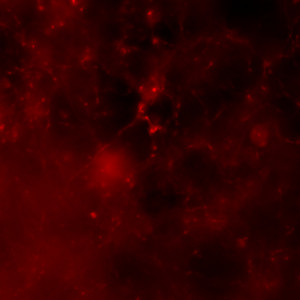
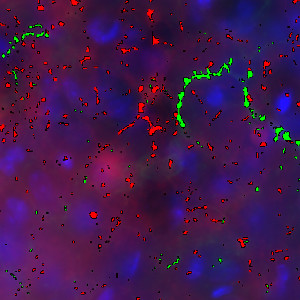
Microscopic view of a region of interest
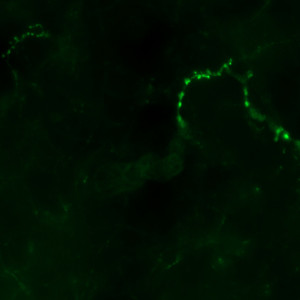
The GFP band in the region of interest
Quantitative Output variables
The output variables obtained from this protocol are:
Workflow
Step 1: Manually outline a region negative for staining
Step 2: Load and run the protocol “01 GFP Threshold” to determine the mean GFP intensity in the outlined region and insert the value into both protocol “02 GFP Intensity” and protocol “03 GFP Density” to handle autofluorescence
Step 3: Manually outline relevant brain regions
Step 4: Load and run the protocol “02 GFP Intensity” for the quantification of the mean GFP intensity
Step 5: Load and run the protocol “03 GFP Density” for the quantification of the GFP density
Step 6: Repeat step 1-5 using protocols “04 mCherry Threshold”, “05 mCherry Intensity”, and “06 mCherry Density”
Methods
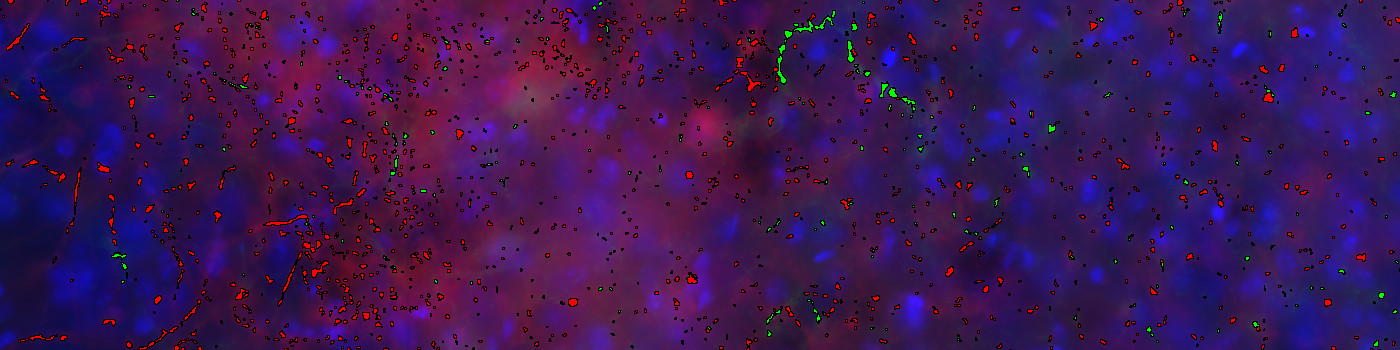
The APP consists of 6 protocols where the first 3 handle the GFP band and the last 3 handle the mCherry band. Two of the protocols calculates the mean intensity in the two different fluorescence band within a region of interest that has been manually selected. This should be a negative region so that the threshold values capture the autofluorescence in the bands. Two of the other protocols subtracts the autofluorescence from the fluorescence bands and subsequently calculates the mean intensity of the bands in brain regions of interest. The last two protocols quantify the density in the brain regions of interest by applying a method similar to the “rolling ball algorithm” for background subtraction, see [1], before using an appropriate threshold for determining the presence of positive fluorescence values.
Staining Protocol
There is no staining protocol available.
Keywords
mCherry, GFP, Fluorescent Proteins, Fluorescence, Neuroscience, Intensity Quantification, Axon Density, Image Analysis
References
LITERATURE
1. Sternberg, S. Biomedical Image Processing, Computer, 1983, 16 (1), 22-34, DOI.