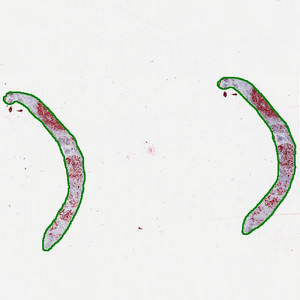
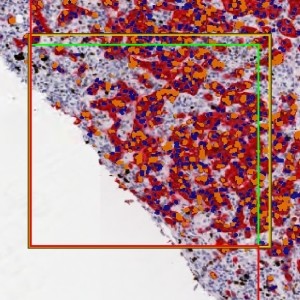
Overview image of the slide showing the ROI outline in green. Original image at 0.5X (scaled down to fit this space). The ROI is automatically detected and outlined with the Auxiliary APP.
#10006
The Ki-67 protein is associated with cellular proliferation, and the protein is present in the nucleus of all cells that are in the active phase of the cell cycle, but absent in resting cells, see [1]. The cell proliferation rate can be assessed by Ki-67-immunohistochemical (IHC) staining, and this can be correlated to the tumor grade and the clinical course for the patient, see [2]. To identify the Ki-67 positive cells within the tumor regions of an image, these regions have to be outlined manually, which can be a tedious and time-consuming task. However, tumor detection in breast tissue sections can be automated by performing double staining with pancytokeratin. Pancytokeratin can be used as a tumor marker, and a nucleus can thus be classified as belonging to a tumor based on the staining of the surrounding tissue. By using double staining with pancytokeratin, automated segmentation of relevant nuclei may be more precise and reproducible, see [3].
This protocol automatically detects and quantifies Ki-67 positive cells within tumor regions. No manual outlining of the tumor is needed, since the tumor region is automatically identified based on the Ki-67/pancytokeratin-IHC double staining. The protocol provides the number of positive nuclei within the tumor region as well as the ratio compared to the total number of nuclei within the tumor region.
Overview image of the slide showing the ROI outline in green. Original image at 0.5X (scaled down to fit this space). The ROI is automatically detected and outlined with the Auxiliary APP.
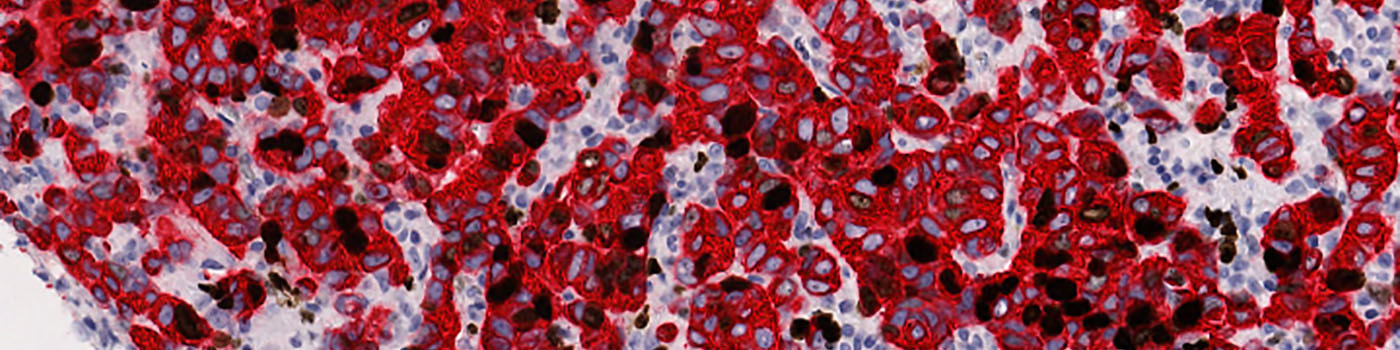
One field of view of the original image 20X (scaled down to fit this space).
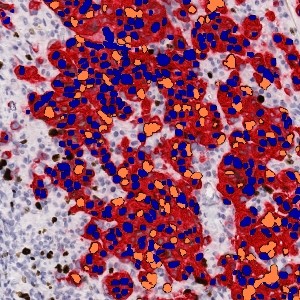
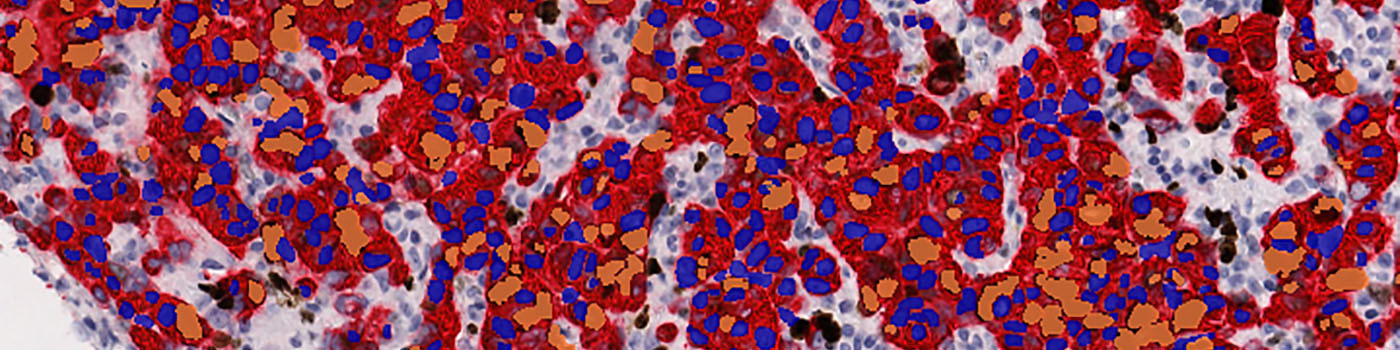
Example of the final detection result. The positive nuclei are labeled with an orange colored label and the negative nuclei with a blue colored label.
Using un-biased counting frames in the detection of nuclei ensures that each object is counted only once.
Auxiliary APPs
Auxiliary APPs are used for additional process steps, e.g. finding Region of Interest (ROI).
The auxiliary APP ’01 Tissue detect’ can be used to automatically detect the region of interest (ROI). This is to save time in the subsequent analysis steps. The analysis is carried out at 0.5x magnification and finds larger pieces of tissue. Dust and small artifacts are ignored. There are no quantitative output variables from this step (see FIGURE 1)
Quantitative Output variables
The output variables obtained from this protocol include:
Methods
The first image processing step involves an automated detection and outlining of tissue samples. The nuclei are subsequently detected as either positively stained nuclei or negatively stained nuclei. In addition, the cytoplasm surrounding the nuclei is found and segmented into tumor areas and non-tumor areas depending on the staining level of the cytoplasm (see FIGURE 2). Next, nuclei with an even brown reaction surrounded by cytoplasm that has been classified as belonging to a tumor region are identified as positive nuclei. Furthermore, as a post-processing step, nuclei that are too small are removed. The image obtained after post-processing (see FIGURE 3) is used to determine the output variables.
Note on counting: Analysis of full virtual slides takes place in a tile-by-tile fashion. If not handled appropriately, nuclei that are intersecting with neighboring tile boundaries would be counted twice (or more). By using unbiased counting frames, see [6], this can be avoided (see FIGURE 4). This principle is implemented in the present APP. Depending on the size of nuclei, the application of this principle could make an important difference.
Keywords
Ki-67, Ki67, pancytokeratin, immunohistochemistry, double staining, breast cancer, quantitative, digital pathology, image analysis.
References
LITERATURE
1. Scholzen, T., et. al. The Ki-67 protein: from the known and the unknown, J. Cell Physiol 2000, 182 (3), 311-22. DOI
2.NordiQC Protocol Ki67 (Last updated: 02.07.09).
3. Bentzer, N.K., et. al. Ki67-labeling index in breast cancer – An immunohistochemical pilot study using double staining to evaluate proliferation rate, APMIS 2010, 118, 15-16.
4. Kårsnäs, A., et. al. Learning histopathological patterns, Journal of Pathology Informatics 2011, 2 (2), S12, DOI
5. Jung, C., et. al. Segmenting Clustered Nuclei Using H-minima Transform-Based Marker Extraction and Contour Parameterization, IEEE Transactions on Biomedical Engineering 2010, 57 (10), 2600-4, DOI
6. Howard, C.V., Reed, M.G. (2005). Unbiased Stereology: Three-dimensional measurement in microscopy. QTP Publications.